Signs of a turning tide at Lloyd's
Despite of another loss making year at Lloyd’s, signs of a hardening market are becoming visible
Lloyd’s published its 2020 results last Wednesday, reporting another loss making year, with a pro-forma combined ratio of 110%. Our own model had predicted a combined ratio of 109%, but more on this in another post.
During the analyst presentation Lloyd’s stated rate hardening in excess of 10% had been reported in a number of classes of business over the last year. However, those rate increases reflect only the perceptions of underwriters on the renewal book. Can we see further evidence in the reported data that the tide has turned?
Reviewing syndicates’ reported combined ratios
The individual annual reports of all syndicates were published last week as well, allowing us to update our ICMR.Matrix tool for the 2020 financial data too. ICMR.Matrix provides a detailed review of syndicates’ performance, including ICMR’s outside-in view on syndicates’ capital requirements.
Indicators for the market’s underlying pricing can be extracted from the distribution of reported combined ratios across syndicates and years. The following chart shows the distribution of syndicates’ combined ratios for the last 10 financial years.
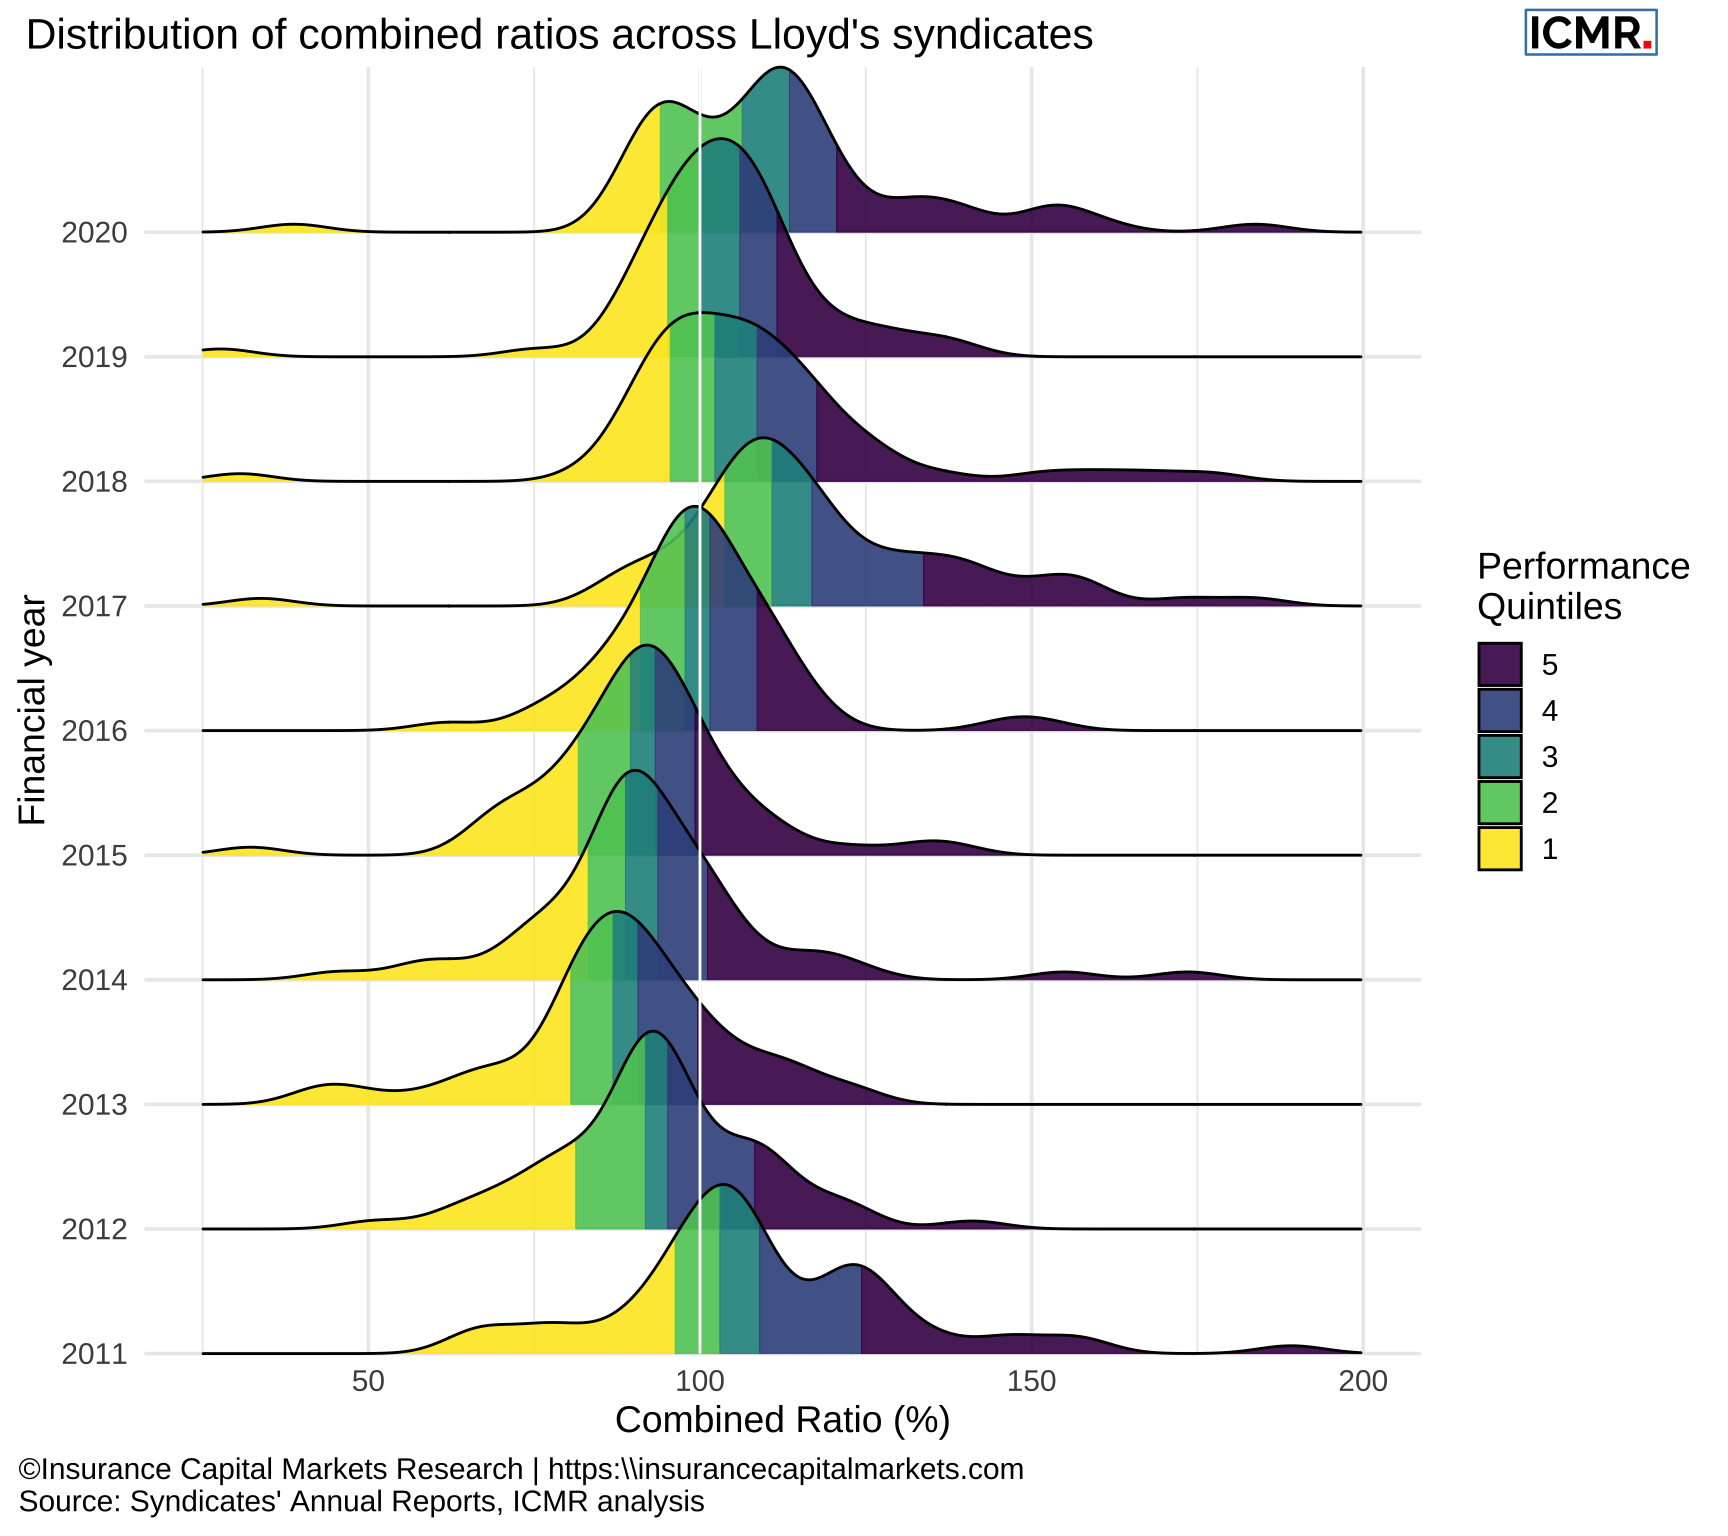
Figure 1: Distribution of syndicates’ combined ratio from 2011 - 2020. All syndicates with a number greater than 6000 (SPAs) have been excluded, as well as the first three years of start-up syndicates and syndicates that wrote less than £20m in each year. SPAs have been excluded since they are reinsurance arrangements of the host syndicate and as such don’t make underwriting decisions, the other syndicates have been excluded as their performance can be very volatile for the lack of premium volume.
The distribution for 2020 looks a little like a wide cowboy hat, with two peaks, similar to 2011. However, unlike 2011, the distribution has shifted slightly to the left and one of the two peaks is now under a 100% combined ratio. Fewer than one third of syndicates reported an underwriting profit and a combined ratio of under 100%.
Signs of a hardening insurance cycle
Reviewing the peaks of the distribution over the years provides an indication of the insurance cycle. Following 2011 we note the peaks shift to the left until 2016, when they are noticeable moving to the right again.
For 2020 Lloyd’s reported an overall rate increase for its renewal book of +10.8%, but the impact of the COVID-19 losses blurs the picture. Thankfully, most syndicates disclosed the impact of the pandemic in the notes to their accounts, explaining for £2.7bn out of £3.4bn of COVID-19 incurred losses reported by Lloyd’s.
Excluding those losses we can notice a considerable shift in the combined ratio distribution, which would substantiate the rate hardening claimed by Lloyd’s.
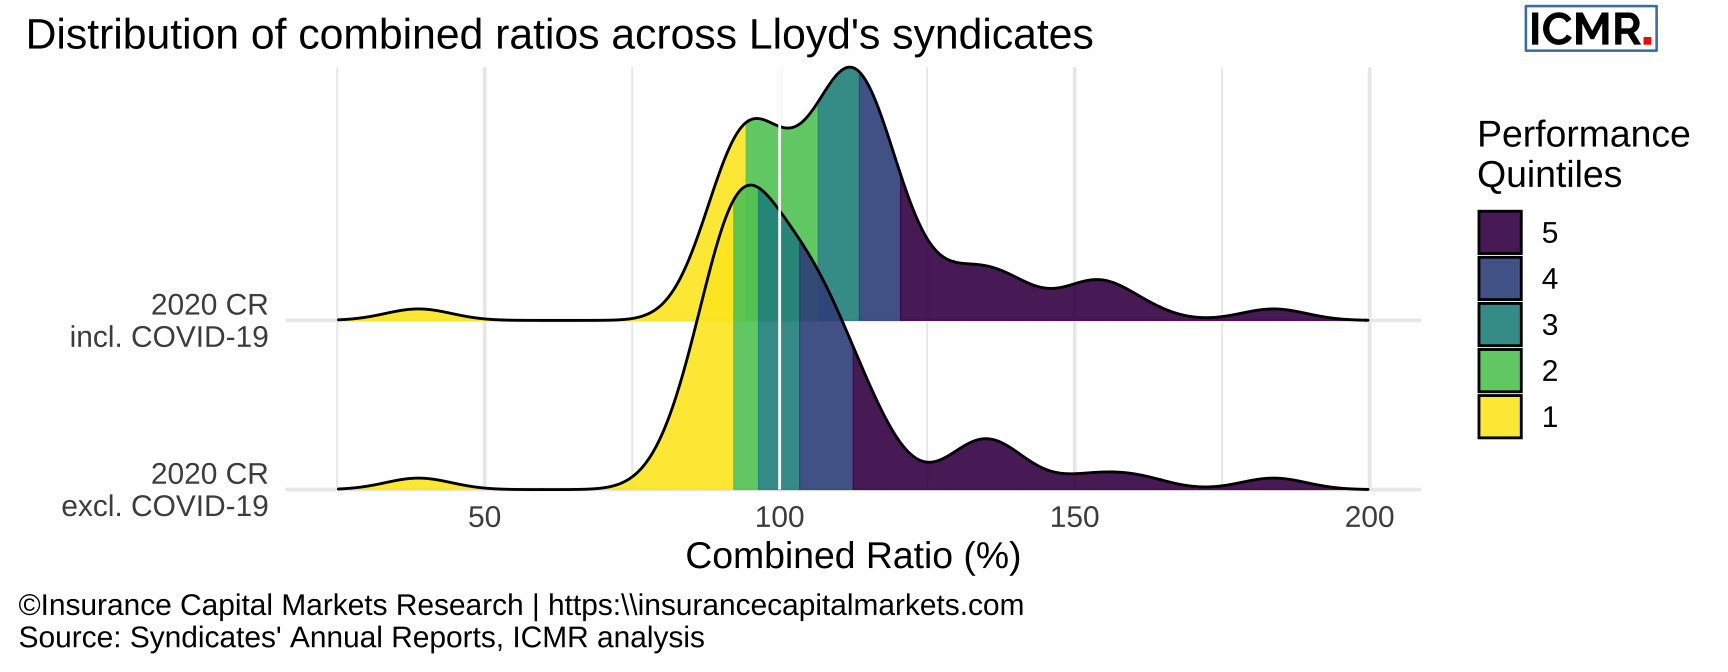
Figure 2: Comparison of reported syndicates’ combined ratio including and excluding COVID-19 losses.
This is a picture that long term market practitioners have observed before, as David Shipley, Chairman of MAP, pointed out in his remarks to MAP’s 2020 annual report: “The last 12 months have seen challenges that very few people anticipated. Uncannily, as with 9/11, the impact of the COVID-19 pandemic has come at a time when the market was starting to inch its way back to health after long years of inadequate pricing and poor underwriting.”
Looking at the trends in Lloyd’s Pro-Forma financial statements, Lloyd’s suggests an attritional combined ratio of 87%, to which must be added a normalised Cat load. This is an inexact science (there always seem to be more attritional losses in Cat event years!), however Lloyd’s long term trend is for major claim “background noise” of around 3% of net earned premium whether in an event year or not. Combine this with the average annualised Cat event claims over the course of the cycle and we get a normalised annual major claim impact of 9%-10% of net earned premium, which accords with Lloyd’s assertion of a “normalised” 2020 standing at a combined ratio of 97%. This compares with the long term actual combined ratio of 98.5%. So, good but not great.
2021 and beyond
Despite the challenges over the last 12 months, Lloyd’s has shown again its ability to adapt. Not only did trading continue almost uninterrupted, but the losses due to the pandemic have not unduly stressed Lloyd’s capital. Signs that underlying pricing has turned for the specialty markets have become more evident, despite the losses of last year, which augurs well for 2021. A more “normal” event year should yield the first market-wide underwriting profit since 2015, which would be a welcome relief to investors. Although even then, in line with our previous articles and given Lloyd’s mix of business, the trend for the majority of investors’ returns to derive from investments rather than underwriting looks set to continue.
For a more detailed review of Lloyd’s and syndicates’ performance and a demo of ICMR.Matrix, please get in touch.