Lloyd's 2021 combined ratio league table
Over 2/3 of Lloyd’s syndicates reported an underwriting profit
The tide has turned at Lloyd’s, albeit not without headwinds. Unlike last year, most syndicates reported an underwriting profit for 2021. Indeed, looking at the distribution of combined ratios across syndicates shows that only the bottom quintile and some of the fourth quintile performing syndicates reported combined ratios in excess of 100%.
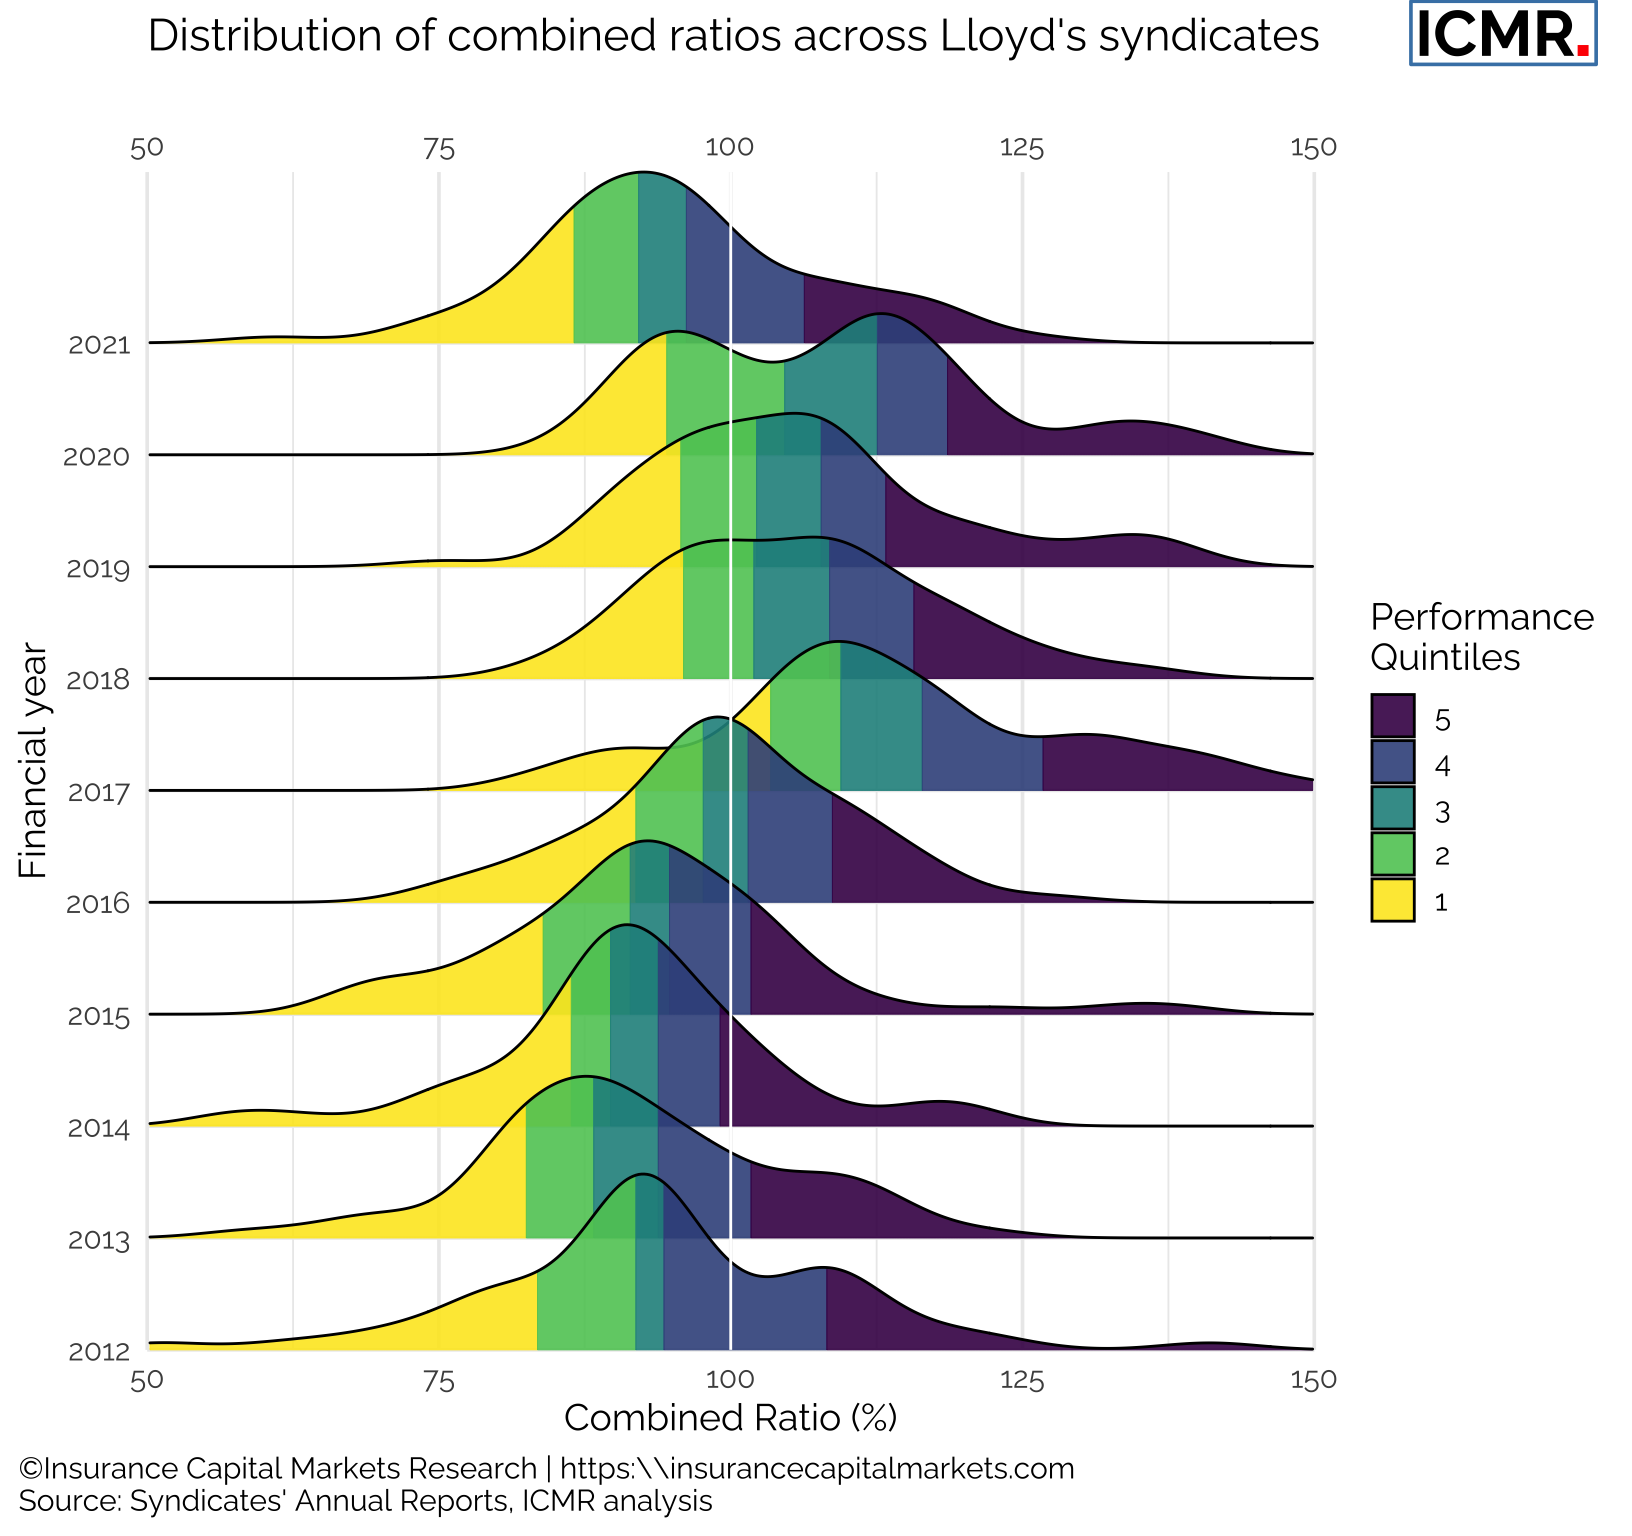
Figure 1: Distribution of syndicates' combined ratio from 2012 - 2021. All syndicates with a number greater than 6000 (SPAs) and with less than £50m of NEP in each year have been excluded. SPAs have been excluded since they are reinsurance arrangements of the host syndicate and as such don't make underwriting decisions, the other syndicates have been excluded as their performance can be very volatile for the lack of premium volume.
The above chart illustrates nicely the impact of the cycle on Lloyd’s. But unlike 2020, where there was a marked difference in performance between those syndicates that were impacted by Covid and those that weren’t, the distribution of combined ratios is a more symmetrical spread for 2021. It appears the rating environment was back to levels seen a decade earlier.
As an investor or follow-only underwriter, this analysis helps to understand how far down the performance league table one can go and still expect to find a profitable underwriting shop. Depending on the insurance cycle, this list grows and shrinks over time.
Let’s take a look at the 2021 Lloyd’s syndicate league table of combined ratios. In 2021, out of 73 active non-life syndicates at Lloyd’s 50 syndicates reported a combined ratio less than 100%. For this analysis 13 run-off, 4 loss-portfolio-transfer, 3 syndicates-in-a-box, 14 SPA and 2 life syndicates were excluded:
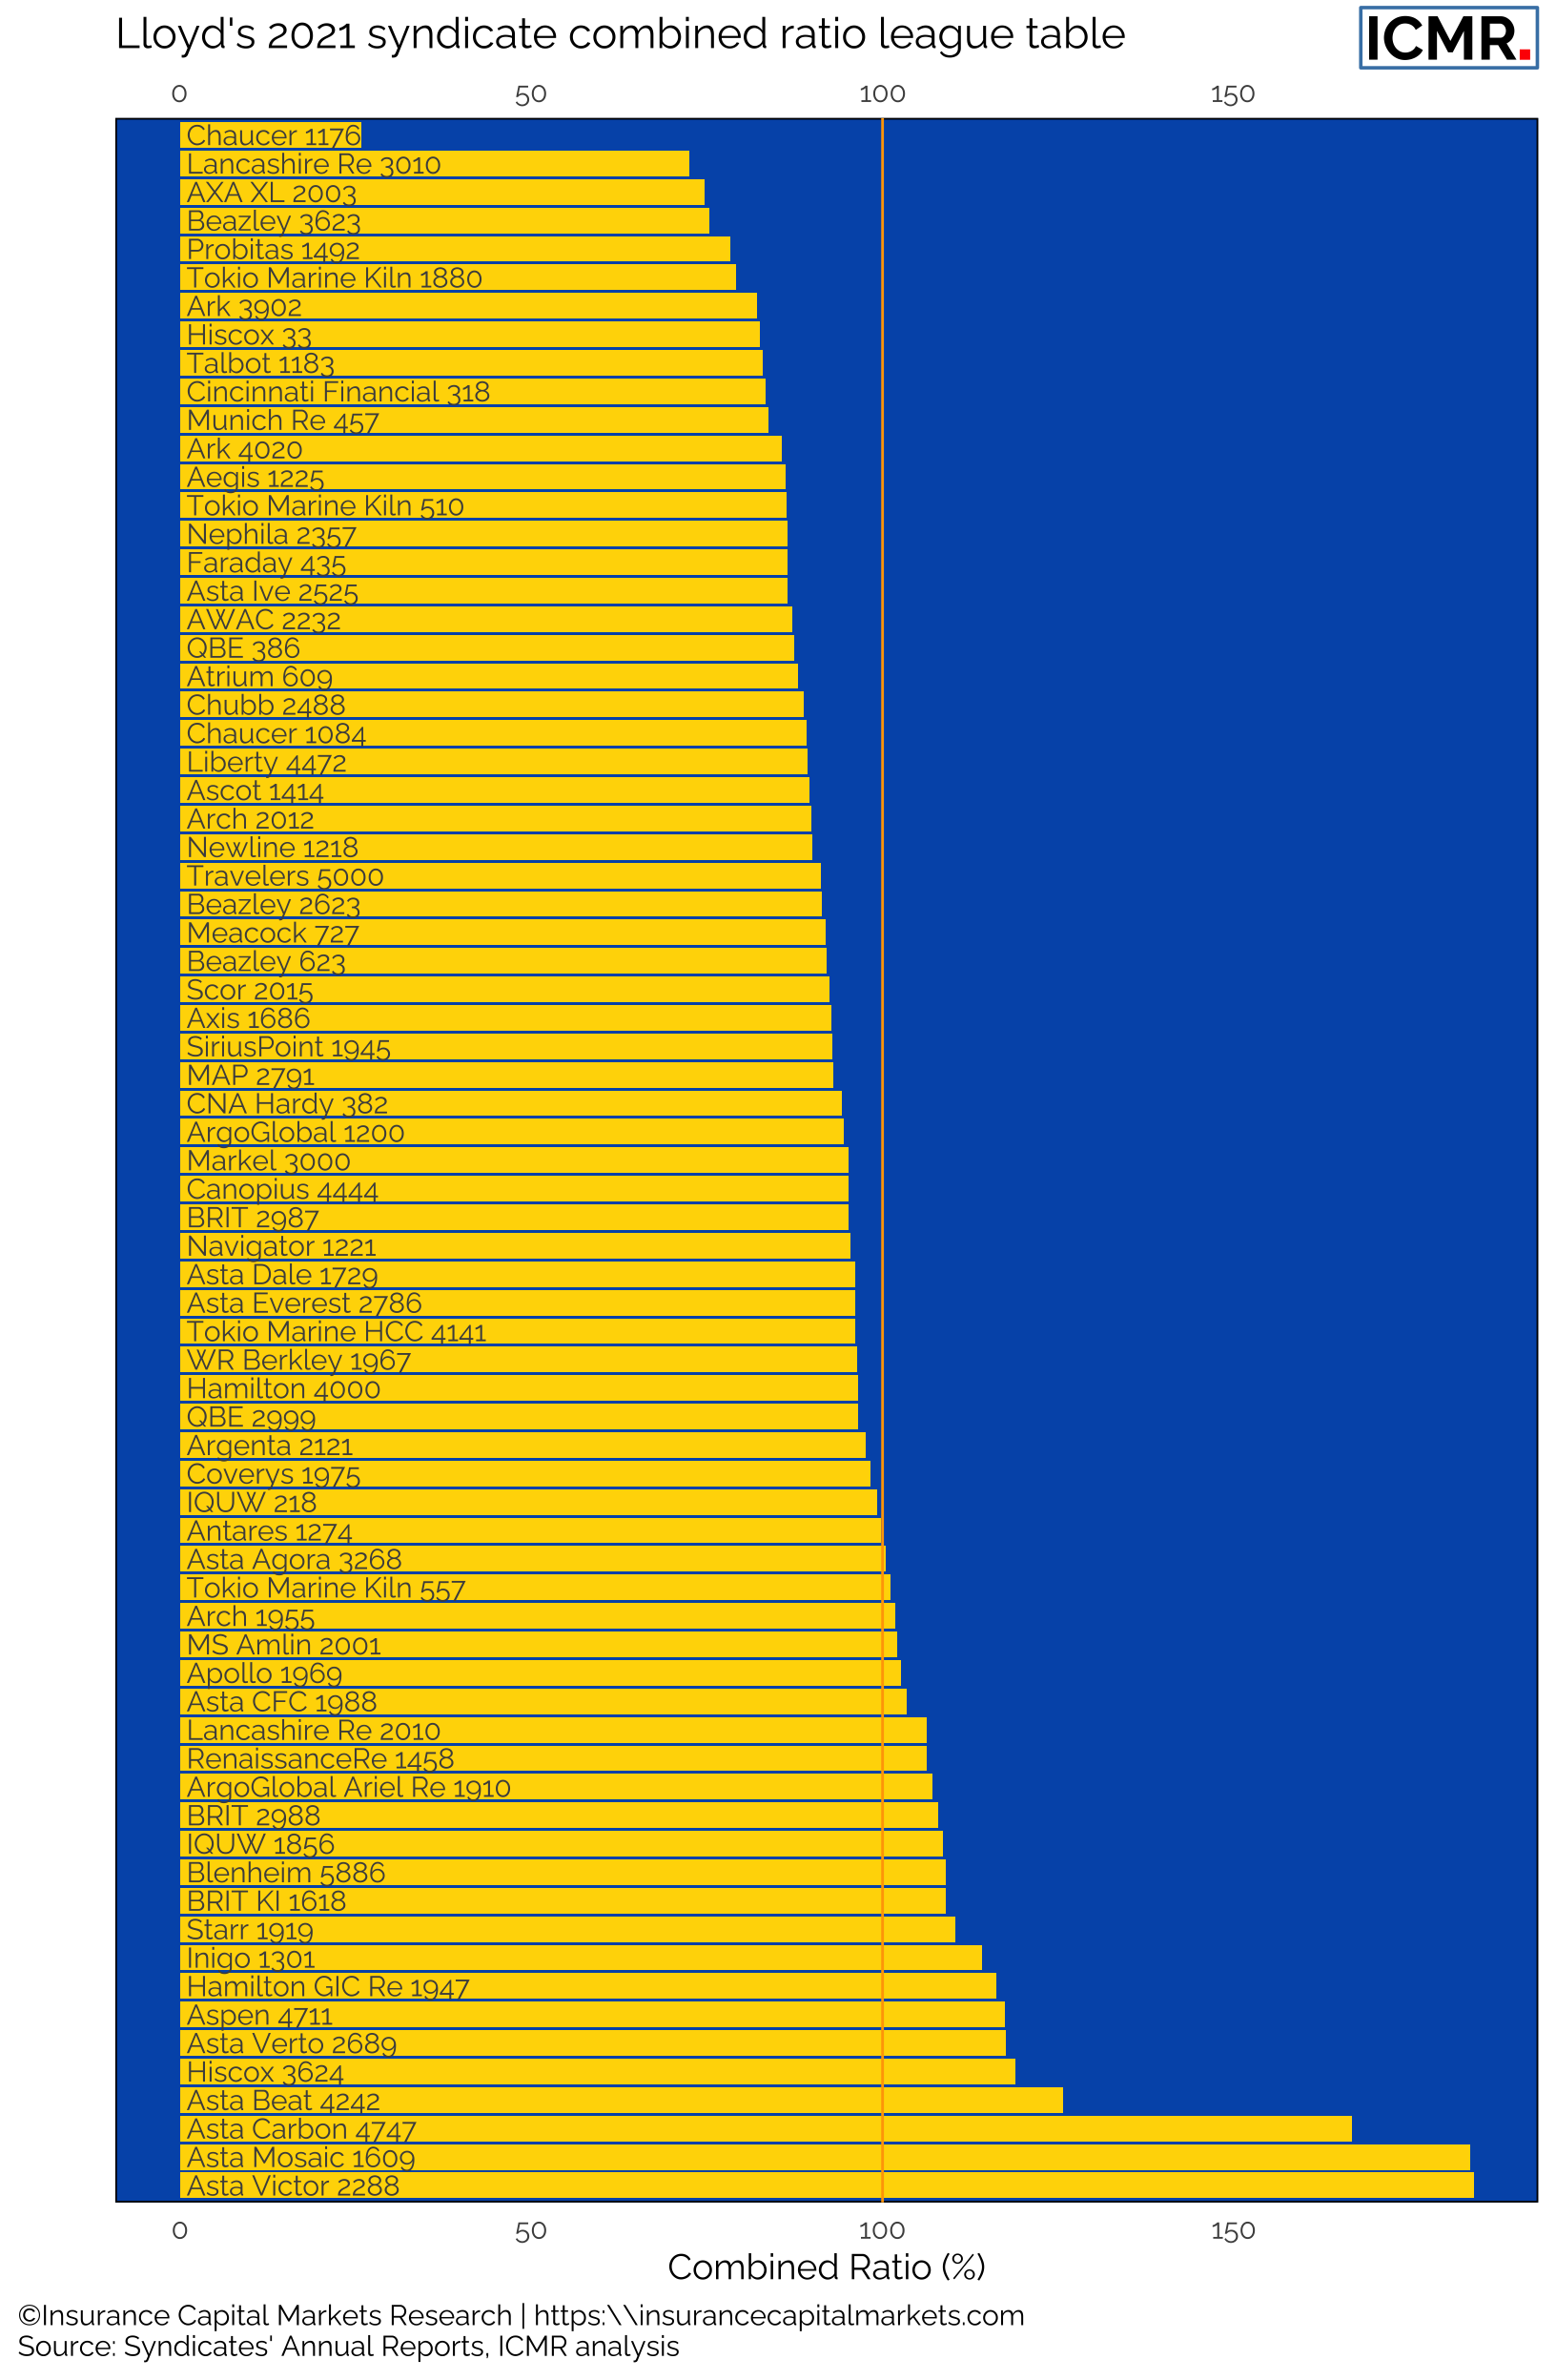
Figure 2: Lloyd's 2021 combined ratio by syndicate. Run-off, loss-portfolio-transfer, syndicate-in-a-box, special purpose arrangement and life syndicates have been excluded.
There are not too many surprises. Many established syndicates with a good track record are near the top and, as expected, some of the start-ups nearer the bottom. Indeed, ICMR’s research has shown that relative performance is much more stable than absolute performance.
Contact ICMR for more in-depth Lloyd’s analysis, benchmark reports, syndicate valuation and the RISX index. RISX is the world’s first equity index for the global specialty (re)insurance sector (calculated and administered by Morningstar; Bloomberg ticker symbols ‘RISX’ & ’RISXNTR’).