Has Lloyd’s finally conquered expenses?
Specialty (re)insurance is a difficult business to scale
One aspect Lloyd’s focused on in the 2021 results presentation was the improvement in the market’s expense ratio from 39.2% in 2018 to 35.5% in 2021. Is this a sustainable trend?
The three principal drivers of expense ratios are acquisition costs, operating expenses and reinsurance spend. The first two affect the numerator of the ratio, the last item affects its denominator. As we showed in an earlier article, it is very difficult for syndicates to reduce acquisition costs over time. This has coincided with the growth of MGA and binding authority business which carries much higher acquisition costs than, say, reinsurance business. Equally, operating expenses tend not to be subject to rapid flux, as syndicates build out their infrastructure and staffing levels. The most impact on expense ratios tends to come from a syndicate’s reinsurance spend; the less spent, the greater the net earned premium, the lower the expense ratio.
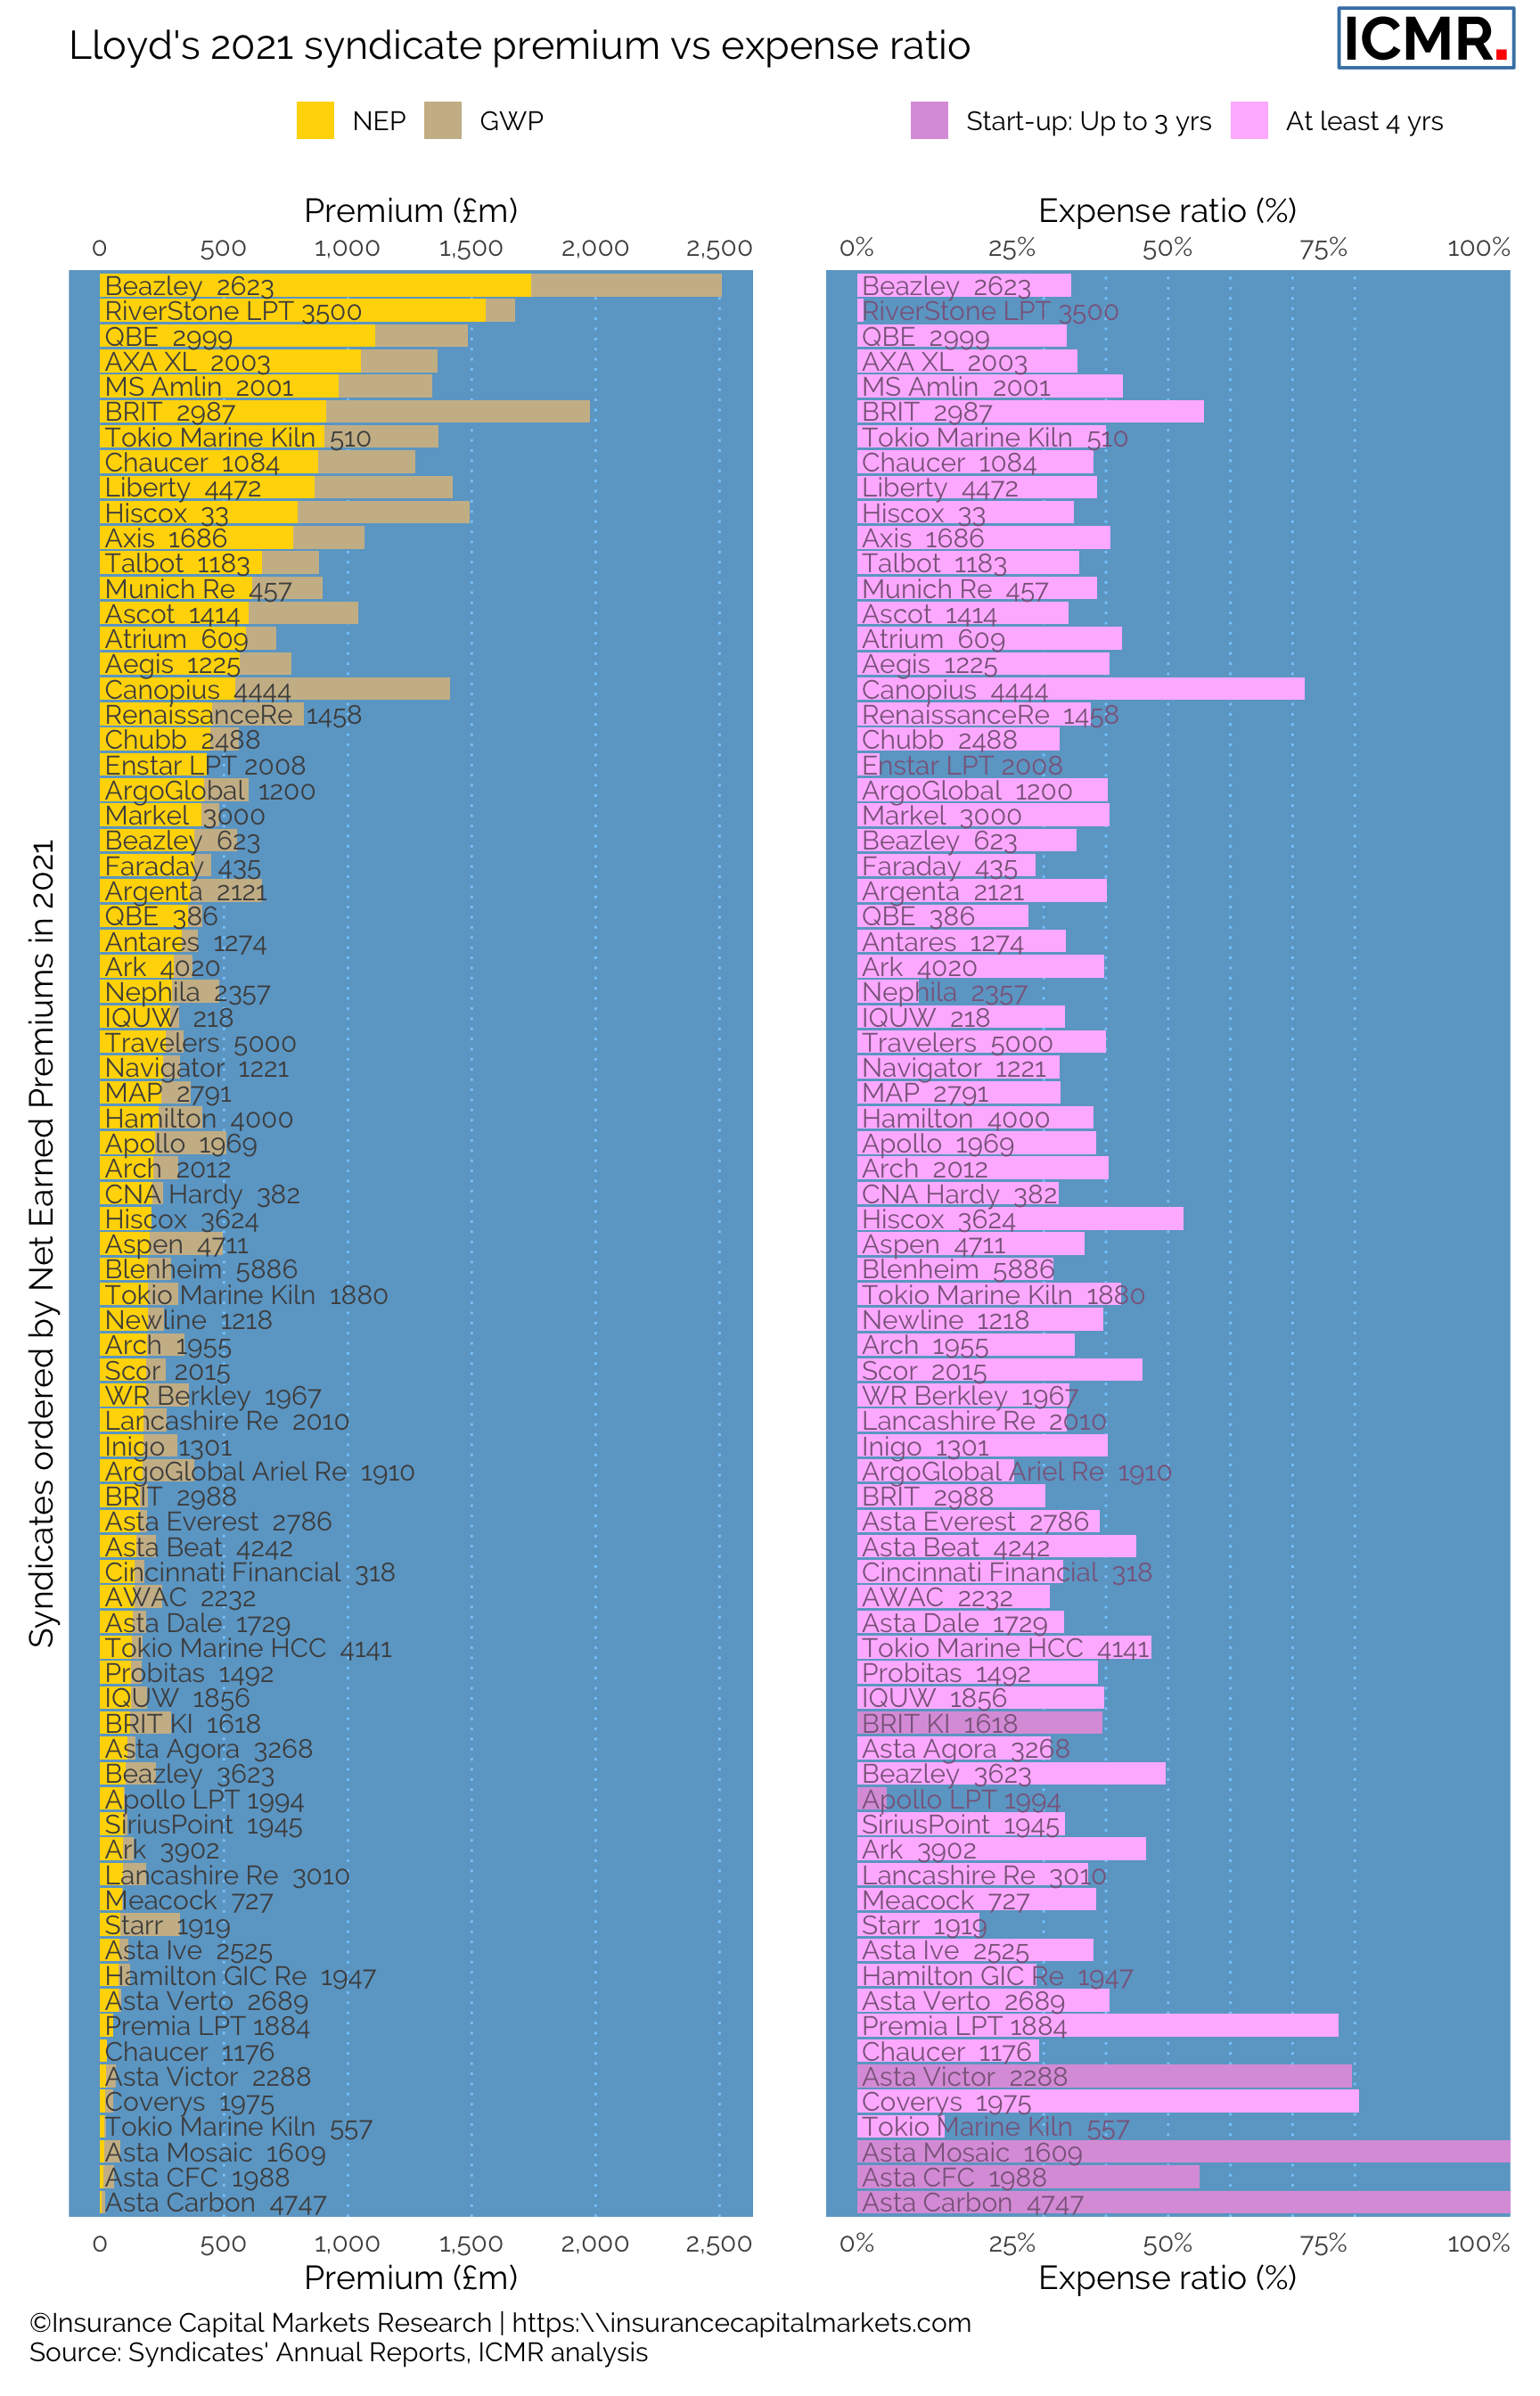
Figure 1: Comparing premiums and expense ratio by syndicate (excluding Life, SiaB and SPA syndicates) for the 2021 financial year. The chart shows that the expense ratio is not correlated with the size of the syndicate. However, loss portfolio transactions (LPT) during 2021 had a significant impact on net earned premiums and hence expense ratio for some. While the expense ratio for the LPT buyer shoots up as net premium reduces, e.g. Canopius 4444, Brit 2987, Hiscox 3624, the expense ratio for the sellers dimishes as the receiver of the reinsurance premiums, e.g. RiverStone 3500, Enstar 2008, Apollo (Compre) 1994
As is apparent from the chart, underwriting isn’t a scalable business. Similar expense ratios apply for syndicates orders of magnitude bigger than others. This shouldn’t be a surprise because no matter how big the syndicate, the same pressures apply to remunerating brokers, building underwriting infrastructure and protecting downside risk with reinsurance. Economies of scale are only available through stable process management, which tends not to lend itself to bespoke underwriting.
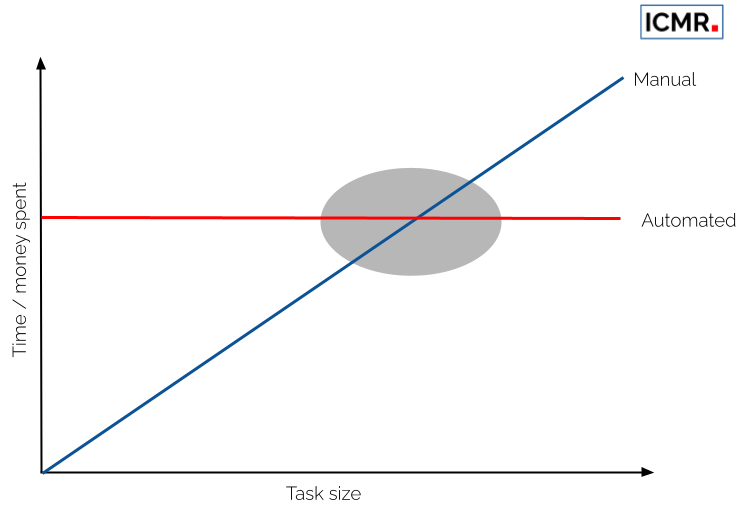
Figure 2: Identifying the tasks and processes of sufficient scale and stability is critical to make automation a success.
The above diagram illustrates the typical symbiosis between manual and automated systems. Whilst there is always scope for such process rationalisation in back-office functions, the range of individual syndicate’s expense ratios shows just how difficult it is to achieve in specialty (re)insurance underwriting. Understanding which processes clearly sit outside the grey area is the challenge. Roll on Blueprints III, IV & V!
Contact ICMR for more in-depth Lloyd’s analysis, benchmark reports, syndicate valuation and the RISX index. RISX is the world’s first equity index for the global specialty (re)insurance sector (calculated and administered by Morningstar; Bloomberg ticker symbols ‘RISX’ & ’RISXNTR’).