What is the value of Lloyd’s and how does it change daily?
Those two simple questions motivated our research into how capital markets data could be used to provide answers on Lloyd’s valuation and to measure its evolution over time. This culminated in the ICMR RISX index, launched in May 2021.
The RISX index is an equity index based on the listed global (re)insurance companies with underwriting subsidiaries at Lloyd’s. Unlike past attempts that aimed to create a Lloyd’s index for risk transfer, e.g., based on loss ratios, the RISX index provides a lens from the investor perspective. If Lloyd’s were a publicly listed company, what would its share price and trailing price-to-book multiple look like and how would they change daily?
Of course, Lloyd’s is not a single company but a marketplace. Yet the Corporation publishes pro forma accounts by aggregating syndicates’ results to provide a comparison to other (re)insurance companies. Furthermore, Lloyd’s is seen as the bellwether for the industry, being the leading marketplace for specialty property and casualty underwriting. That’s why many (re)insurance companies have subsidiaries at Lloyd’s. Indeed, most of the capital at Lloyd’s is provided by publicly traded companies.
The question is, can the price data of syndicates’ publicly listed owners be aggregated in a way that proxies Lloyd’s risk profile, i.e. its pro forma combined ratio?
At ICMR, we believe the answer is ‘yes’. Our innovative methodology relies on premium weighting instead of market capitalisation, used by many other stock indices like the S&P 500 or FTSE.
This is not the first time we have developed a benchmark based on premium weights. Previous research has helped to establish the performance management framework at Lloyd’s by creating premium-weighted underwriting benchmarks to compare loss ratios of one syndicate against a notional market with the same risk code split.
The RISX index employs similar ideas using net written premiums disclosed in the syndicates’ financial statements and those of their parent firms. The premium share of each syndicate compared to its parent and Lloyd’s, together with the premium share of the parent to its peers, is used to answer how important the syndicate is to its parent and to Lloyd’s, as well as how important the parent is to the industry. The weights are then calculated from those three premium shares for each index component
Using the RISX index weights to aggregate the reported combined ratios of these publicly listed owners of syndicates results in a close match with Lloyd’s pro forma combined ratio. Not surprisingly, Lloyd’s combined ratio tends to be slightly better in good years and slightly worse in bad years compared to the RISX portfolio, indicating that Lloyd’s underwriting is a little more volatile. Furthermore, given that most listed companies report their results in February, ICMR is able to predict Lloyd’s combined ratio four weeks prior to the Corporation’s publication with remarkable accuracy.
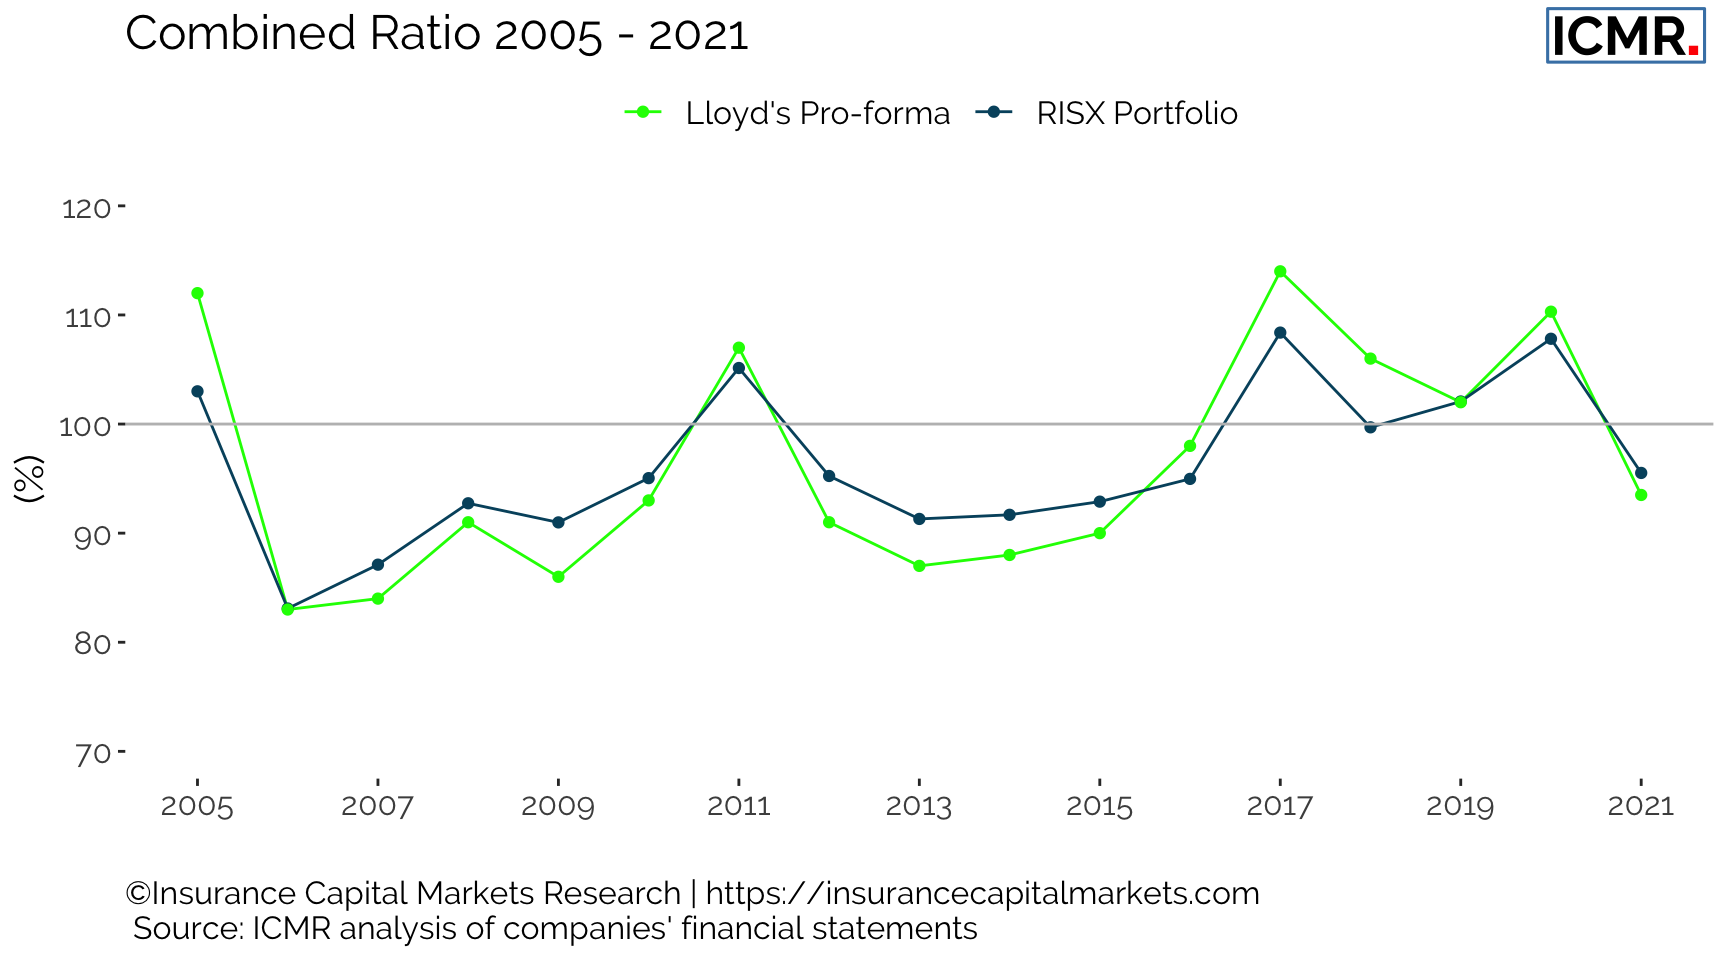
Figure 1: RISX combined ratio vs Lloyd's Pro-forma combined ratio
We argue other metrics can be aggregated in the same way using the RISX weights to gain more insight into Lloyd’s and its valuation. The key valuation metric in the (re)insurance industry is the price-to-book multiple. The chart below shows the distribution of trailing price-to-book multiples of the publicly listed owners of Lloyd’s businesses at the end of March of each year, with the aggregated RISX portfolio highlighted in red. Our research demonstrates the aggregated RISX portfolio P/B can be regarded as a proxy for the Lloyd’s market.
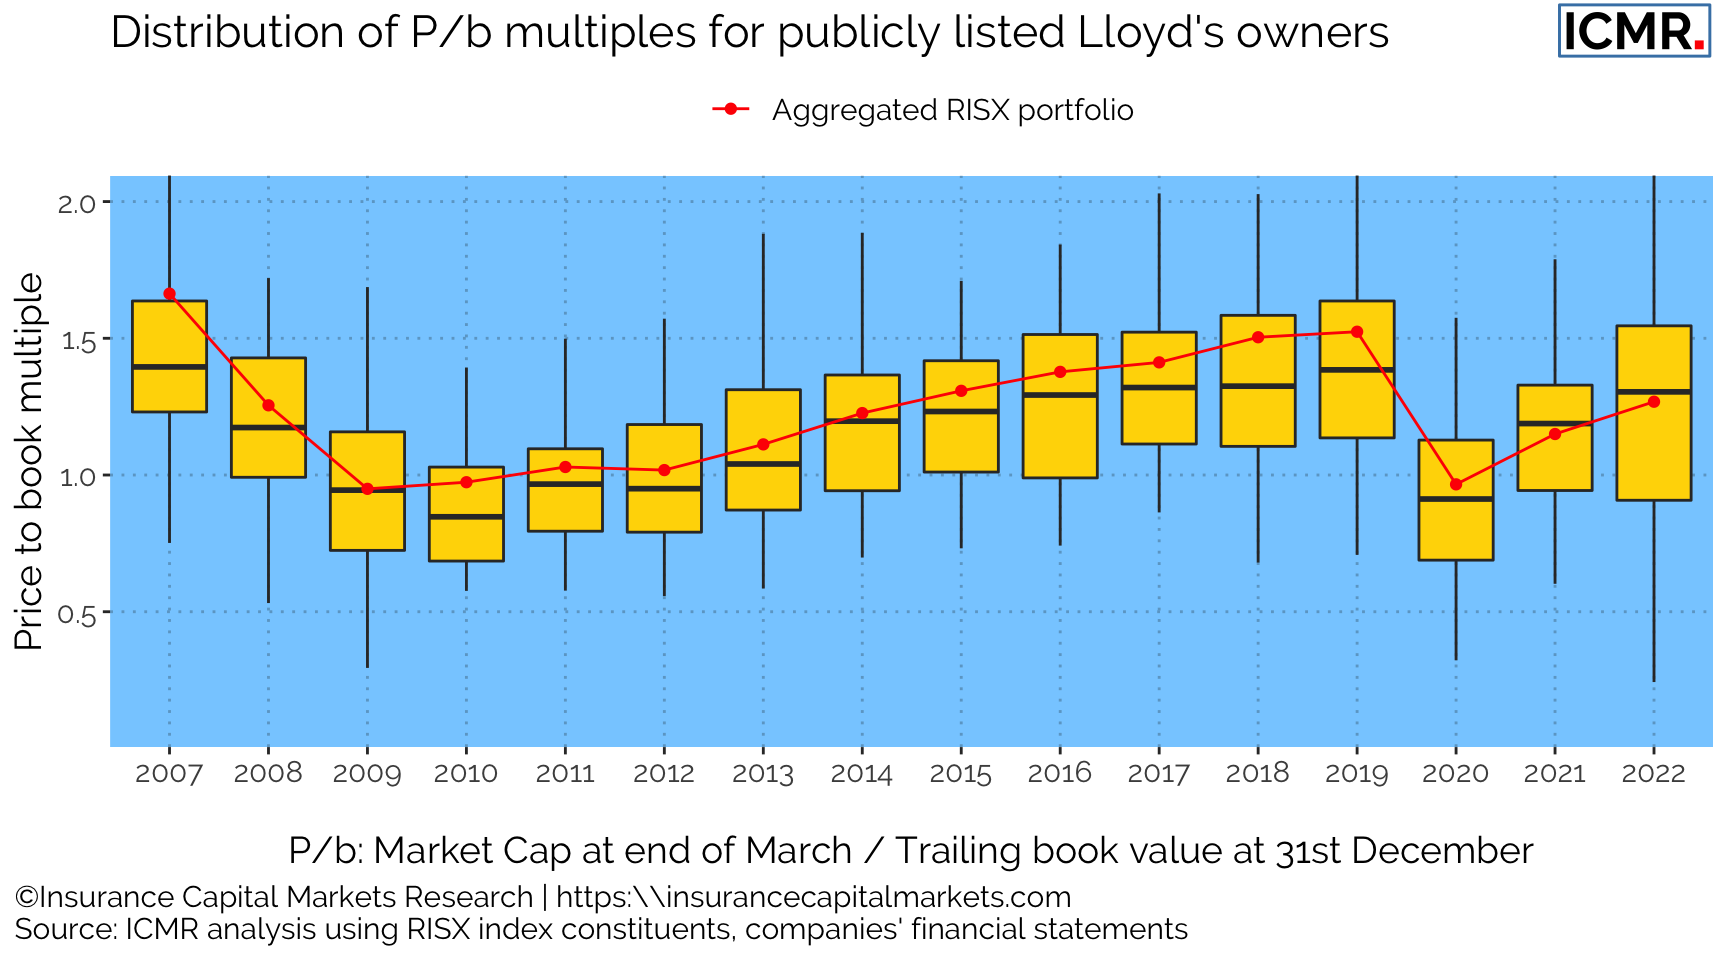
Figure 2: Price to book multiples of publicly listed global specialty (re)insurance companies with Lloyd's business. P/b multiple measured at end of March in each year against the companies' trailing book value.
Apart from the most recent period the RISX P/B has been better than the median performance of the constituents, a testament to Lloyd’s central decision-making over which companies it allows to manage Lloyd’s business and which syndicates it allows to grow or shrink in its marketplace. Furthermore, it demonstrates that for most businesses owning a Lloyd’s underwriting shop enhances its value proposition.
Finally, aggregating the share price movements of the RISX equities provides insight into the daily change in capital markets perception of the valuation of the industry and allows for a direct comparison between other indices, such as the MSCI World index in the chart below. It demonstrates that the global special (re)insurance industry wasn’t impacted by the financial crisis as much as many other sectors, while the Covid-19 outbreak had a significant impact from which RISX share prices didn’t recover as quickly as others, and yet compared to the more recent pressure on equities from rising inflation and interest rates the RISX index is holding up much better.
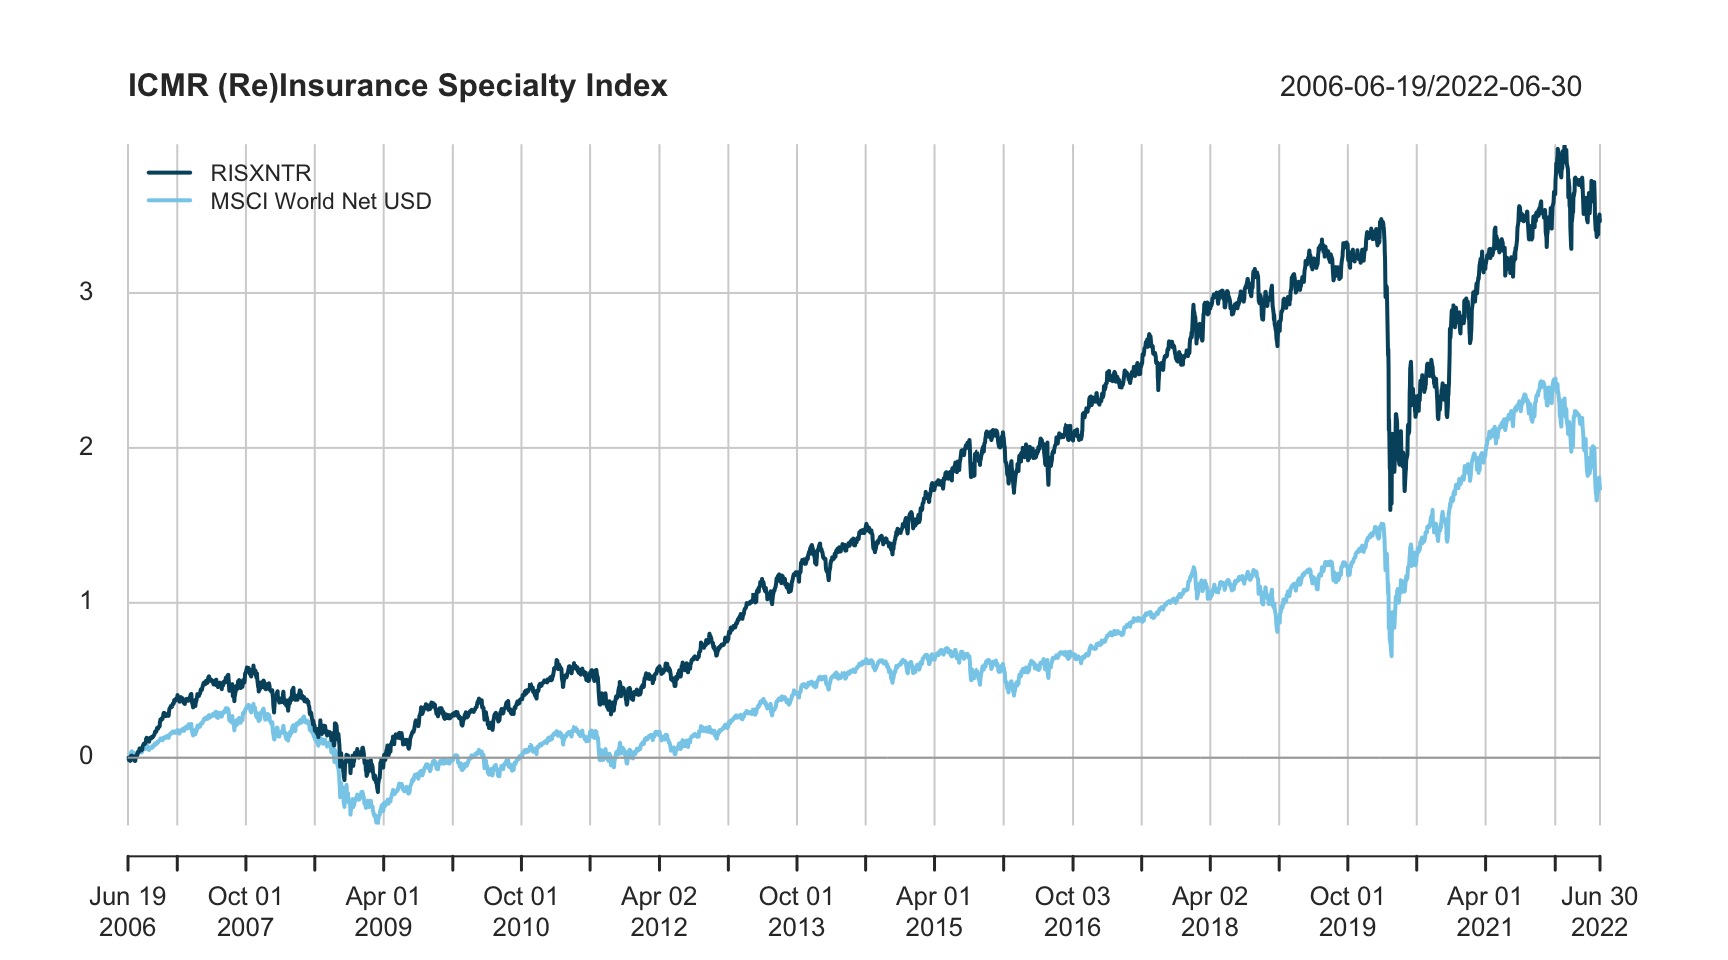
Figure 3: RISX Net Total Return vs MSCI USD Net Total Returns
In summary, the RISX index is an equity benchmark that provides a benchmark for investments into the global specialty (re)insurance sector and given how closely its risk profile mimics that of Lloyd’s, a proxy for Lloyd’s itself, if it were a publicly traded company.
This article was also published as a Viewpoint by The Insurer.