Insurance cycle has opened a window of opportunity for investments in Lloyd’s
To assess whether investments in Lloyd’s are worthwhile, investors’ expected returns must be compared against the weighted average cost of capital (WACC).
Establishing Lloyd’s WACC is by no means an easy task as the cost of equity and debt have to be estimated.
However, the RISX equity index of publicly traded parent companies at Lloyd’s allows for a calculation of the ‘as-if’ market capitalisation of Lloyd’s and its beta (a measure of a stock’s volatility in relation to the overall market), both of which are key inputs in the calculation of the WACC figure.
Insurance Capital Markets Research (ICMR) – which developed the RISX equity index calculation – also suggests using earnings as a function of market capitalisation as a measure of the ‘real return’ to investors (to compare against Lloyd’s WACC), rather than the pro forma return on capital.
This is because investors have to pay a premium to access underwriting capital, for example, by buying shares of listed parents or acquiring capacity.
The following chart shows ICMR’s calculation of Lloyd’s WACC along with Lloyd’s real returns to investors from 2007-2021, plus ICMR’s forecasts for 2022 and 2023.
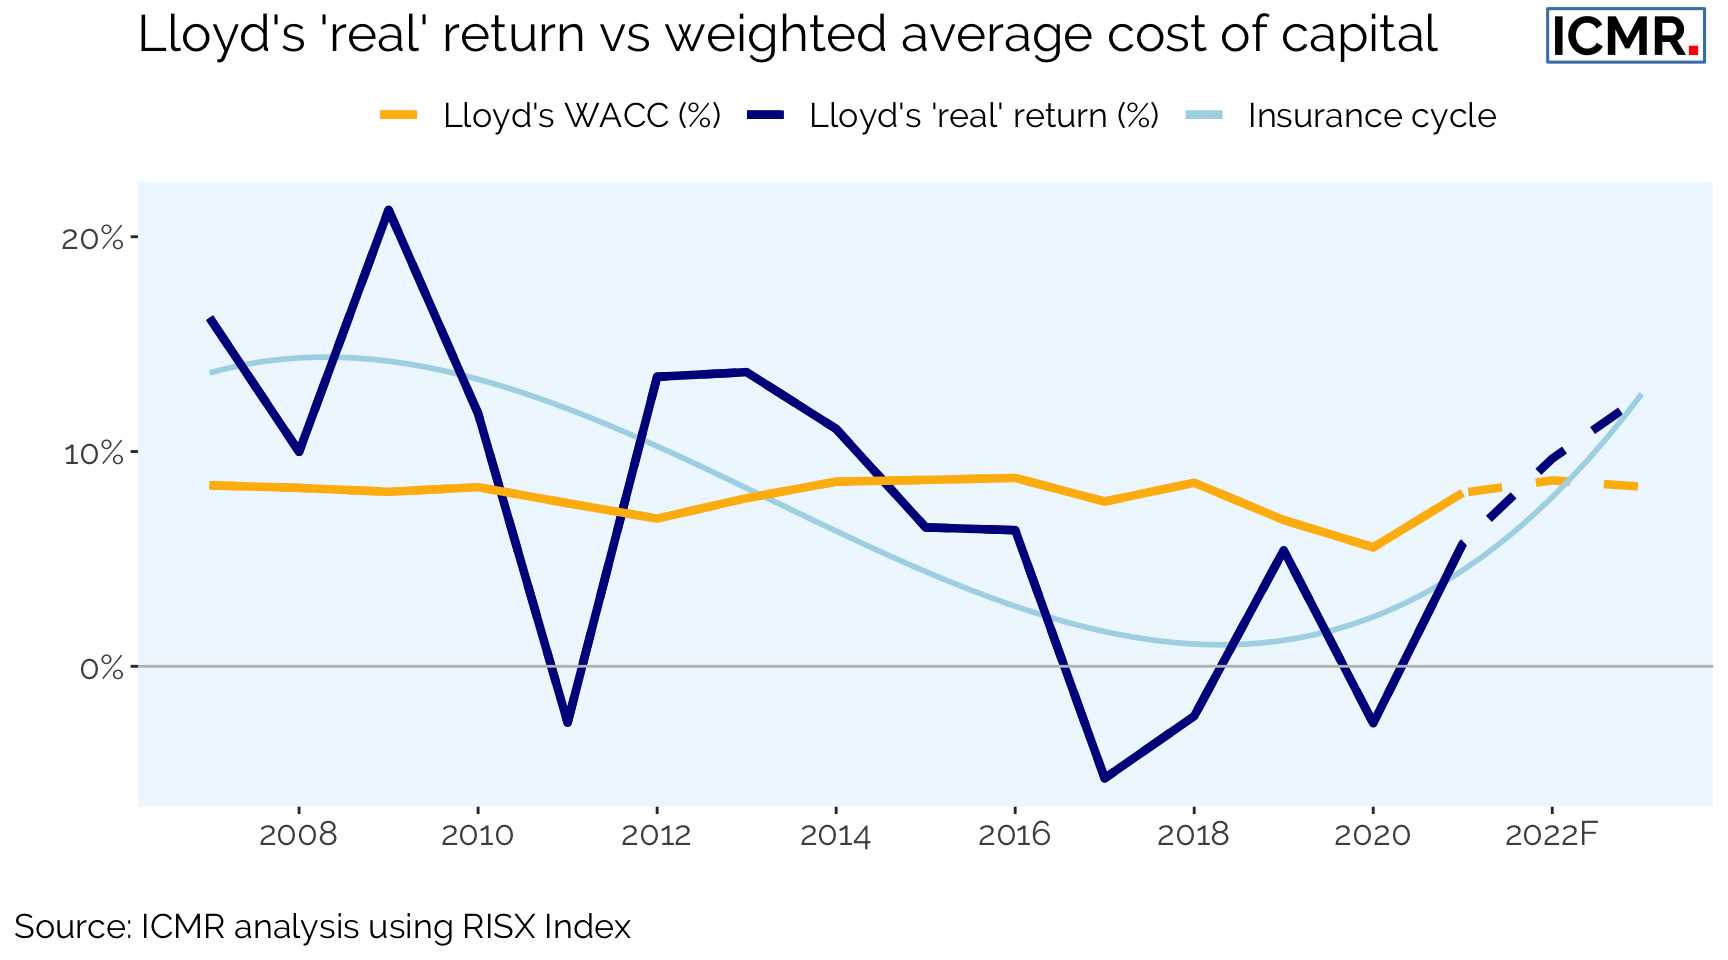
Figure 1: Lloyd's 'real' return vs weighted average cost of capital 2007 - 2021 and forecasts for 2022 - 2023
The chart shows that until 2014, Lloyd’s real returns generally exceeded WACC, with the exception being 2011 with its very severe multiple catastrophe losses.
The market was softening for several years thereafter, and it appears it hardened enough to finally return to a state that should deliver returns in excess of WACC in 2022 and 2023, as forecasted by ICMR.
This coincides with equity analysts’ sentiment that suggest the global specialty (re)insurance market is currently an under-priced investment.
Internal analysis by ICMR shows that individual performance and valuation can vary significantly across companies.
However, with several businesses allegedly up for sale in Lloyd’s, a window of opportunity for investors to acquire a good business at a fair price may have opened.
Note
The above chart shows Lloyd’s WACC calculated using the following formula:
\begin{aligned} \mbox{WACC} & = Re \, \frac{E}{V} + Rd \,\frac{D}{V} \left(1- Tc\right)\\ \mbox{where:} & \\ Re & = \mbox{Cost of equity} \\ Rd & = \mbox{Cost of debt} \\ E & = \mbox{Market value of equity}\\ D & = \mbox{Market value of debt} \\ V & = D + E \\ Tc & = \mbox{Tax rate} \end{aligned}
The calculation of the market value of equity uses the RISX equity index of premium weighted publicly listed companies with Lloyd’s subsidiaries as a proxy and its P/B multiple (currently c.1.1x). The market value of debt has been taken from the publicly traded Society of Lloyd’s debt issues. The cost of equity has been derived from a CAPM model using US 10-year treasury bonds as a proxy for market risk free returns, beta was modelled via linear regression of the excess risk-free monthly returns of the RISX Net Return equity index versus MSCI World Net USD index on a rolling five-year basis, and market premium was assumed to be US equity premium, sourced from Aswath Damodaran, loaded by 1 percent to reflect the global nature of RISX/ Lloyd’s.
The comparative Lloyd’s “real” return to investors shows the result as disclosed in Lloyd’s pro forma accounts divided by the market value of Lloyd’s (the term “$V$“as defined above) and does not use Lloyd’s regulatory capital as its denominator.
This article was also published as a Viewpoint by The Insurer.