To lead, or to follow ... that is the question!
Successful follow-only strategies can create more value than those of traditional leadership roles
For many years, the traditional view of value creation in underwriting was through securing leadership positions on preferred business. The unarguable logic is that, how else can pricing, terms and conditions or claims be monitored and controlled successfully without being a leader? This same logic led to the rapid evolution of Lloyd’s from an exclusively agency market in the early 1990s to the predominantly verticalised underwriting and capital market it is today. If capital directly employs and controls underwriters who directly control terms and pricing, then a virtuous loop is created for capital investors. The logic is obvious, but it isn’t strictly true in practice. The early years of verticalisation saw many of the same bad underwriting habits continue, leading to the failure of many companies, and the needs of cycle management has led many underwriters to move back to agency arrangements once more. Plus ca change!
There is much circumstantial evidence that illustrates how successful some companies which specialise in following specific leaders have been over many years. Unfortunately, there is no public domain database to interrogate about who leads and who follows. But this precise point can be proven by induction using public domain information from listed global (re)insurance companies, specifically the constituent companies of the RISX equity index. This index was established as an “as if” equity proxy for the Lloyd’s market, based on the global (re)insurers that Lloyd’s has admitted to trade there.
The first essential question for any successful following market to pose is about whether certain leaders are consistently good, or consistently bad. This is where analysis of relative performance becomes so powerful. The following table shows just how consistent these 40+ companies’ relative (not absolute) performance has been over the past 15 years:
| Top half performing company: | Bottom half performing company: |
|---|---|
| staying in the top half: 90% | staying in the bottom half: 90% |
| dropping into bottom half: 10% | climbing into top half: 10% |
The table shows how likely it is that companies which comprise our RISX equity index maintain their above or below median performance on a rolling 5-year basis. Source: ICMR analysis of RISX index constituents’ financial statements.
Taking this knowledge, the next question to ask is how to tell if one is not “buying in” to an outperformer at too high a price (the equivalent of following a leader downhill). Again, relative performance analysis is crucial to answer this question, but now overlaying the pure relative performance with actual relative pricing. Here we use trailing Price-to-book multiples of each company’s shareholders’ equity. This clearly points not only to where superior performance can be followed, but also crucially when to follow:
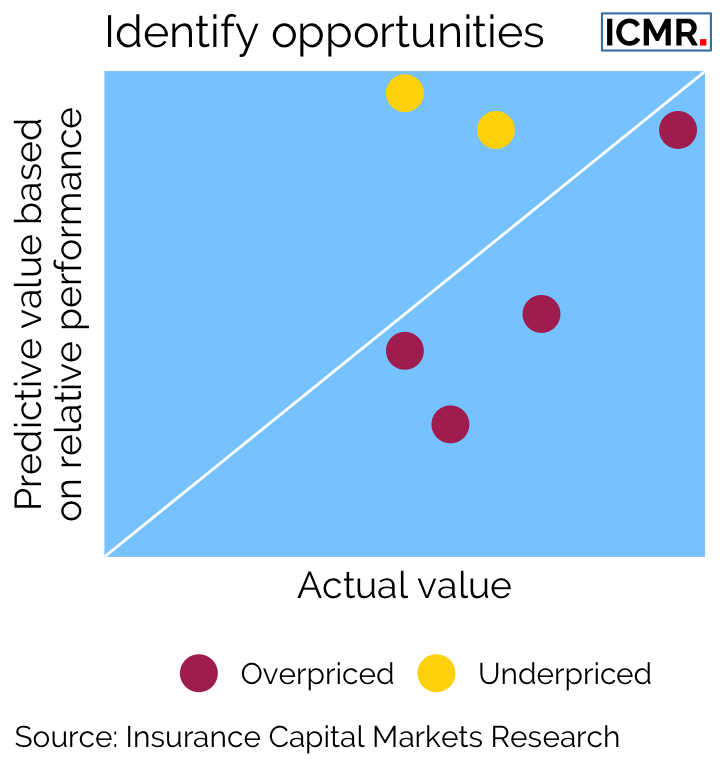
Combining these two analytical concepts creates an algorithmic smart follow (or smart beta) strategy. As can be seen from the following chart, applying such a simple approach can generate intrinsically superior returns, as well as lower volatility:
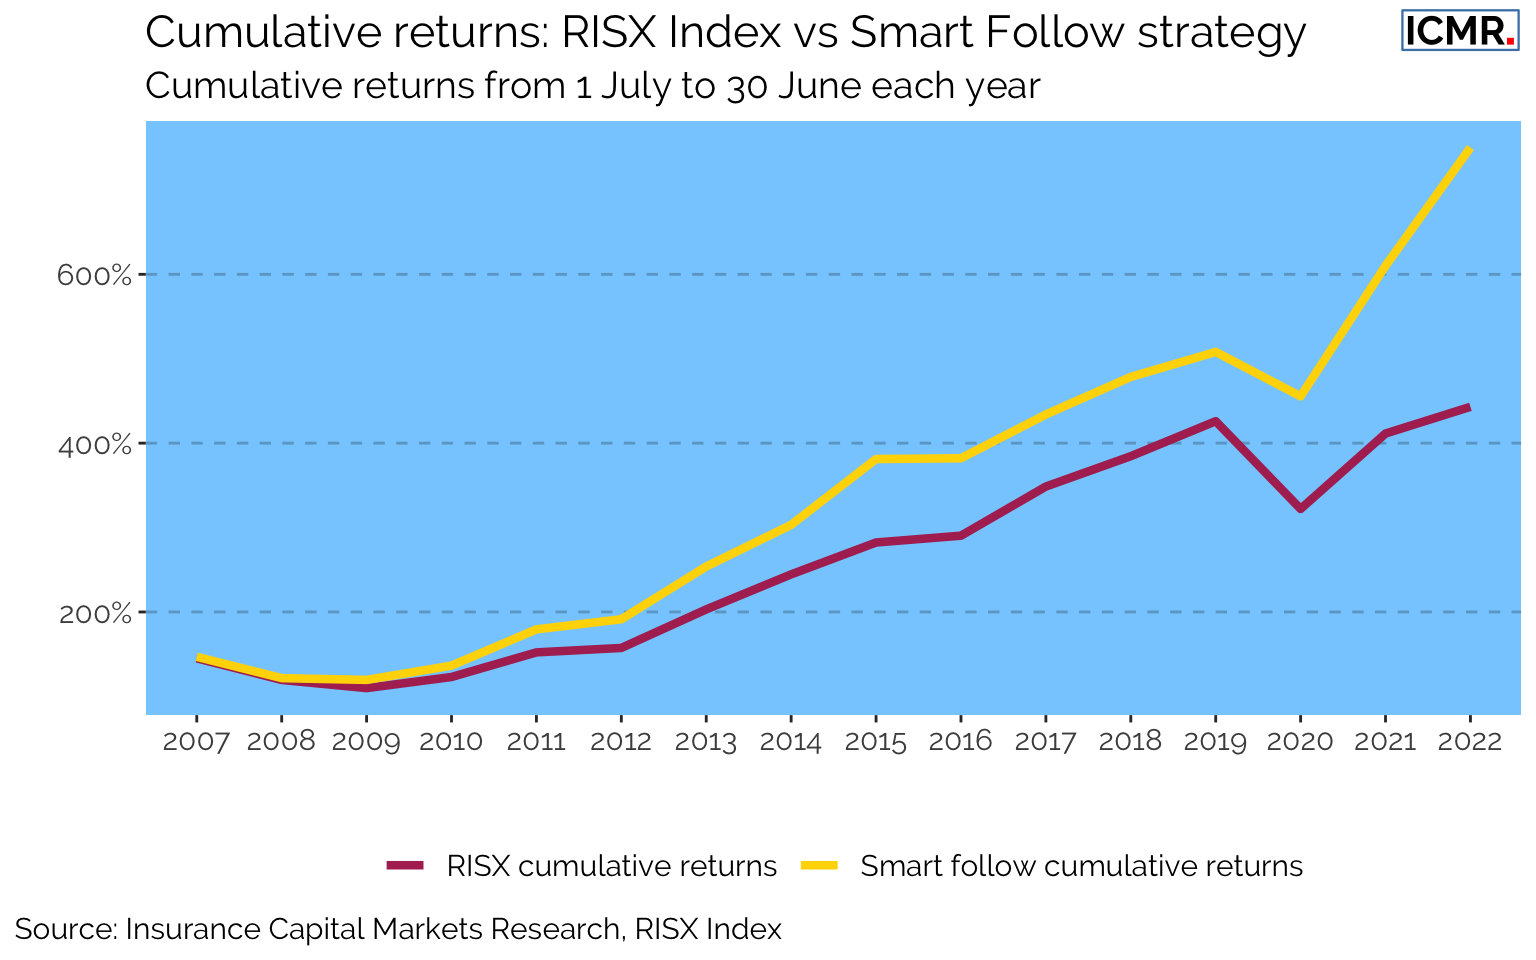
The key point is that inherently superior returns, and therefore value, can be derived from smart follow only strategies, potentially even superior to some leaders’ strategies. However, the most essential part is understanding the data and asking the right questions of the data to inform strategic decision making.
This article was also published as a Viewpoint by The Insurer.