Lead versus follow in ownership of syndicates
Are follow-only strategies a smart alternative to the model of value through verticalisation?
Lloyd’s is expected to grow significantly next year, given the announcements by many syndicates. Time to get into Lloyd’s assets, but how? Follow a portfolio or build your own by acquiring positions across syndicates, and at what price?
There has been a market to buy and sell capacity for over a quarter of a century, but the market remains imperfect, not least because of the restricted number of syndicates available. What if there were an empirical way of valuing capacity regardless of syndicate, whether aligned or non-aligned?
Using relative historical performance data and extrapolating from previous work on modelling expected relative values (our previous article on ‘lead versus follow’), we can derive “outside-in” relative valuations for syndicates. These are based on the industry standard metric of the price being a multiple of the book, or shareholders equity, value. The daily distribution of the valuations of publicly listed (re)insurance companies can then be used to derive a daily syndicate price to book (P/B) value.
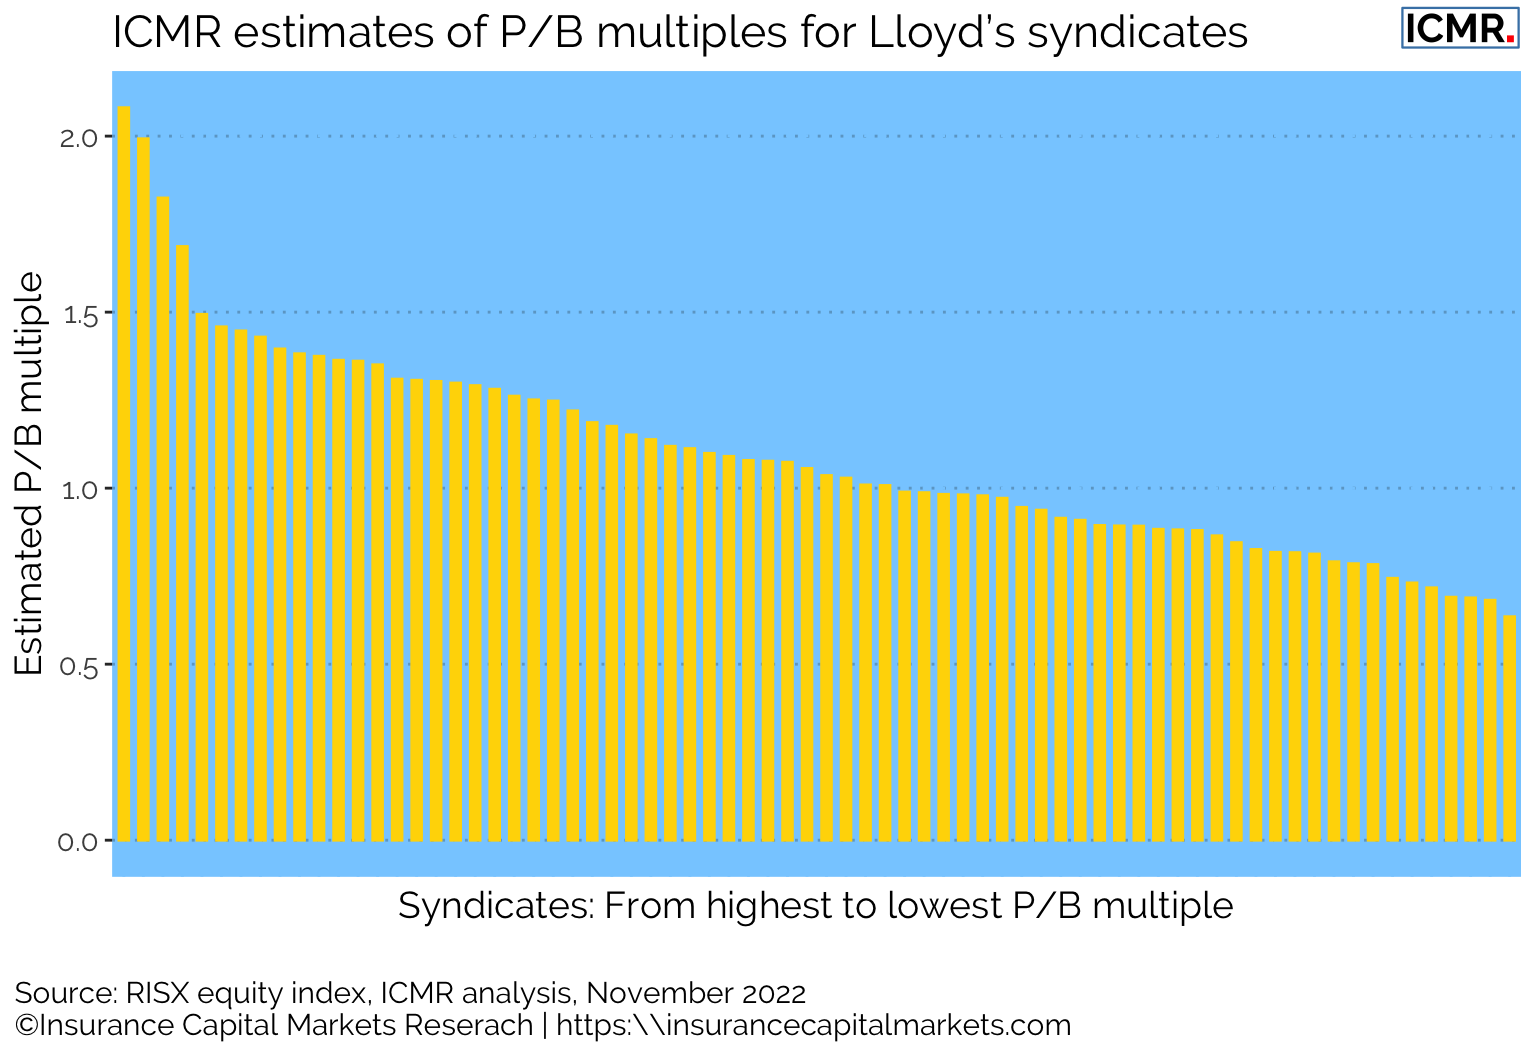
Figure 1: ICMR uses a mark-to-model to provide daily valuation of Lloyd’s syndicates, derived from the RISX equity index and its constituents’ trailing balance sheet data, ICMR’s outside-in view on syndicates’ capital and trailing syndicate performance data. Each syndicate is modelled as if it were a fully aligned entity with one capital provider.
Coupling this analysis with an outside-in view on syndicate capital allows for the value of capacity to be isolated, whether for non-aligned members or for an integrated Lloyd’s vehicle (ILV). Comparing this empirical data-driven analysis with actual recent capacity auction results shows some interesting pricing anomalies:
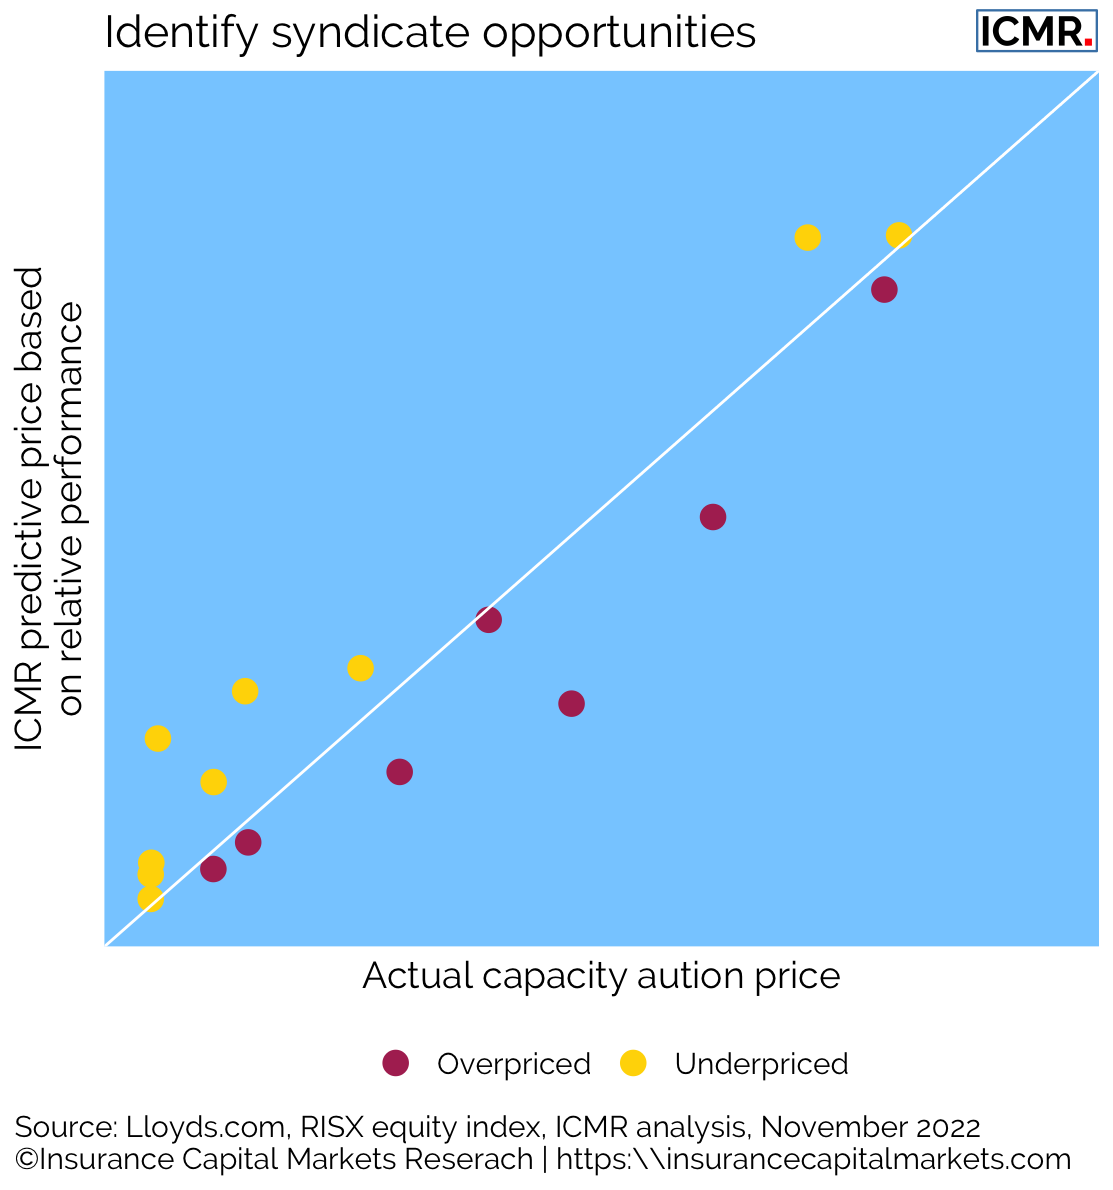
Figure 2: ICMR estimate of capacity price based on relative performance and capital markets prices vs 2022 capacity auction prices for non-aligned syndicates.
The above chart illustrates that more opportunistic capacity purchases may also have a role to play in portfolio optimisation along with the more traditional flight to quality, dependent upon where we are in the cycle. Also, the above analysis shows that whilst capacity sales have hitherto been restricted to non-aligned syndicates, an active market in ILV SPA capacity could also be a route to testing enterprise value for that ILV without the need for undertaking a full sale process.
However, the wider point here is that, as with previous analyses, there are data-driven smart opportunities for investors to participate in insurance as an asset class. Whether this is done through data ingestion at a policy level within a follow-only syndicate, or smart analyses of risk versus reward in building an optimised portfolio of syndicate capacity, or even building and insurance equity portfolio, the end point is the same; an insurance investment with an optimised Sharpe ratio without the day-to-day management headache.
This article was also published as a Viewpoint by The Insurer.