Lloyd’s net underwriting profitability trends disappoint
Line of business performance data from multiple years of individual syndicate reports and accounts, captured and curated by ICMR, reveals a surprising dichotomy between gross and net underwriting performance
The analysis of underwriting profitability trends by line of business is of particular interest to capital looking to support the new “follow only” initiatives. It also illustrates how successful, or not, the market has been at improving underlying performance over time.
The data used has been extracted from each individual syndicate’s segmental analysis from their reports and accounts — an as-yet-untapped data set.
An almost doubling premium footprint in eight years
We can clearly see that Lloyd’s has almost doubled its GWP over the last eight years.
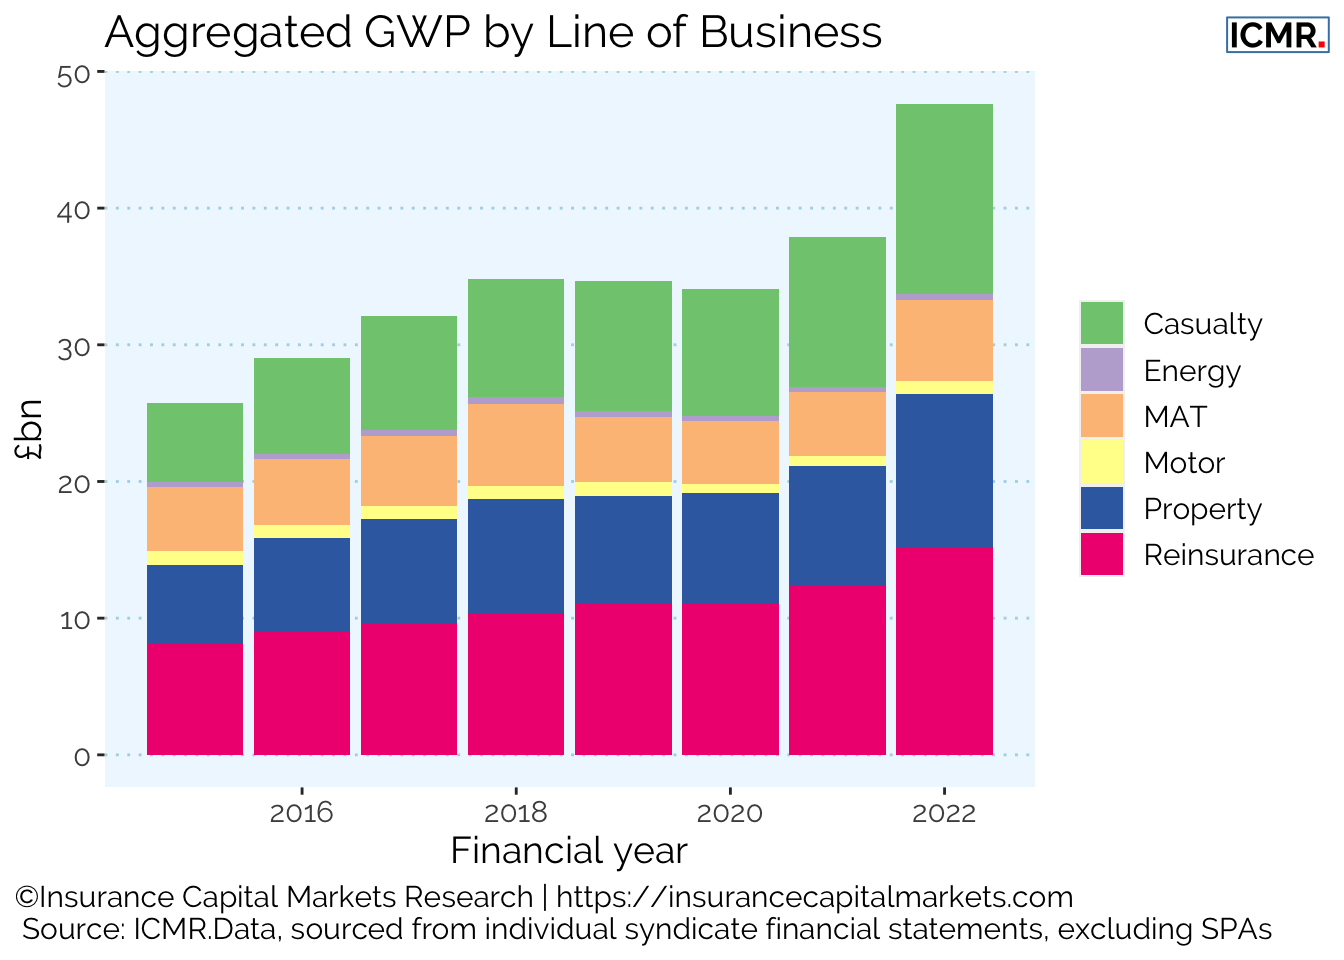
Sterling has weakened over the period, from USD 1.42 to USD 1.24, but the growth in premium has been real, driven most by casualty classes closely followed by reinsurance and then property.
Energy, marine aviation and transport, and motor have barely changed volumes and in real terms have probably gone backwards.
Favourable gross underwriting profitability
On a calendar year basis, how have these changes in volumes affected gross underwriting results?
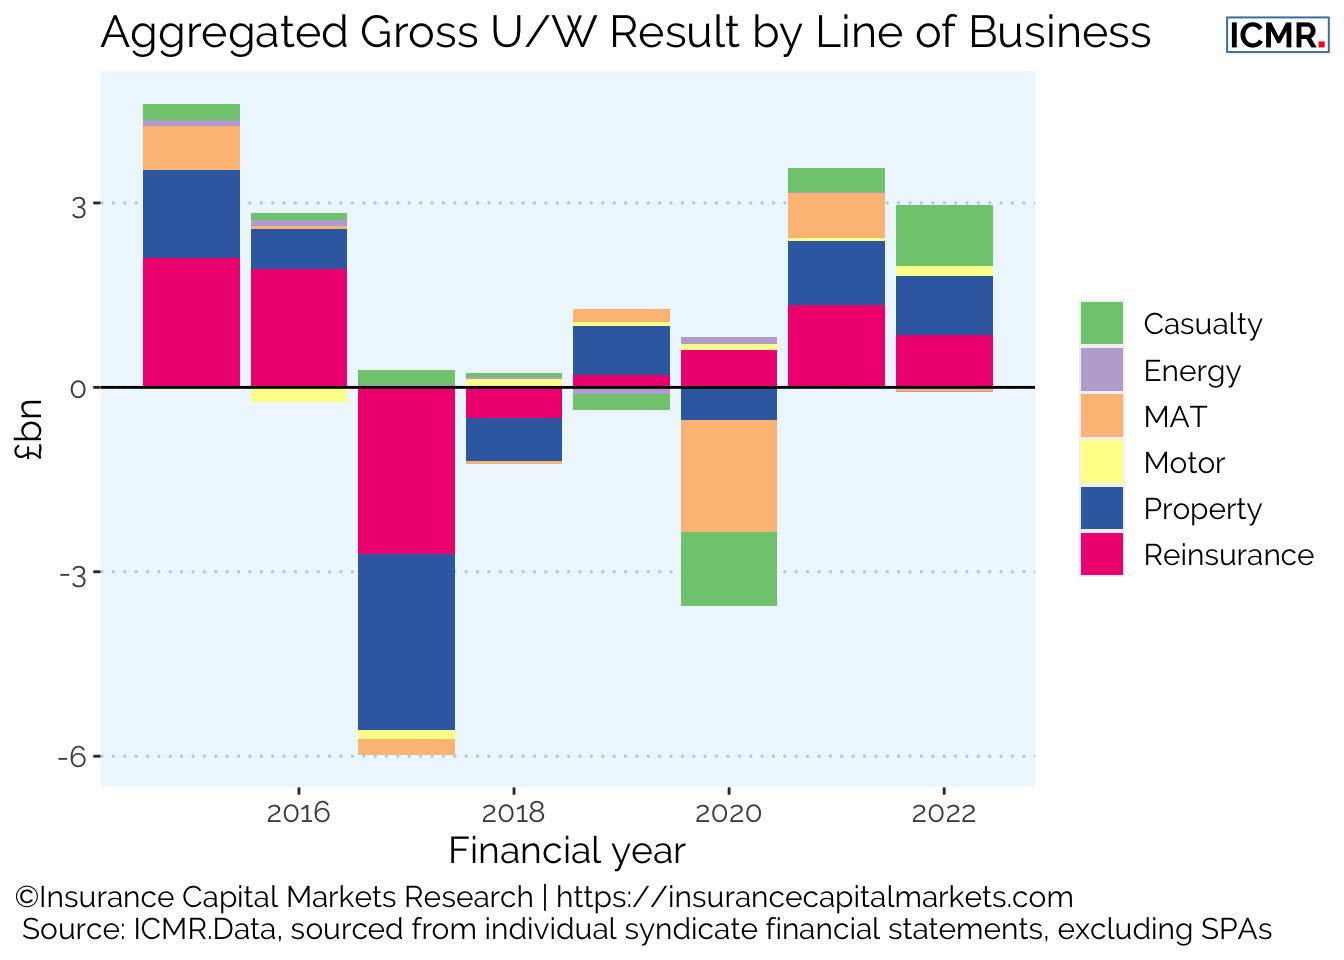
Reinsurance ought to deliver a favourable outcome in years with an absence of major cats and that is indeed borne out by the calendar year results.
Despite the impact of the losses from hurricanes Harvey, Irma and Maria in 2017, aggregate gross profit exceeded £3.8bn, giving an average gross combined ratio of just over 95 percent.
Property fared less well with an aggregate gross profit just exceeding £0.75bn and an average gross combined ratio of 98 percent.
The interesting story is casualty, which despite nearly tripling premium volumes, delivered an aggregate gross profit of £0.6bn and an average gross combined ratio of 99 percent.
Hardly a ring endorsement of its premium growth strategy.
The remaining classes delivered a gross underwriting loss of £0.1bn (gross combined ratio 100 percent) which must call into question either underwriters’ aggregate pricing ability in these classes or their longer term viability as a source of gross profit.
Net underwriting profitability disappoints
Turning to the calendar year net underwriting results by line of business, a very different picture emerges.
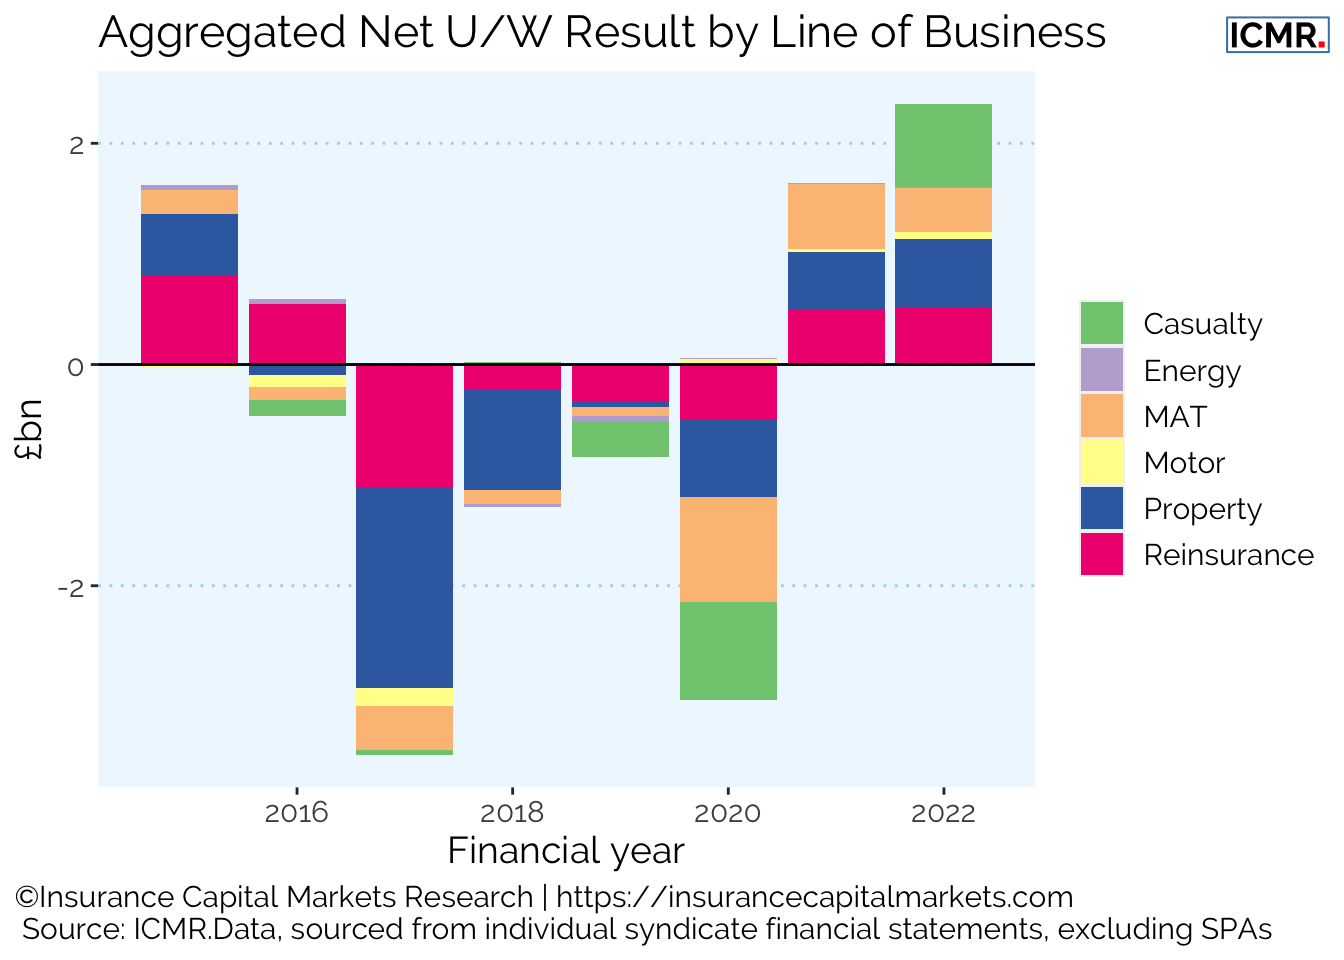
The only major class that achieves an aggregate profitable net underwriting result is reinsurance with a positive underwriting result of a mere £200mn, compared to its gross profit of £3.8bn.
Over the last eight years of calendar year results, all Lloyd’s lines of business have given up whatever gross underwriting profit they achieved, and more, to reinsurers.
This has turned a £5.1bn gross underwriting profit into a £2.9bn net underwriting loss.
Whilst some of this can be explained by the accounting for LPT transactions, not all of it can.
So either the market in the aggregate is paying too much for its reinsurance, or it’s buying the wrong type of reinsurance.
Whether this reinsurance is being bought to reduce earnings volatility, or underwriting volatility and therefore capital, it clearly isn’t delivering for investors.
And while these figures don’t take account of investment returns on the underwriting float, 2022 showed how volatile these can also be for investors.
With all the recent (and ongoing) banking turmoil in the financial services sector (Silicon Valley Bank, Credit Suisse and First Republic Bank), investors will likely need to see more consistent positive news before wanting to return.
This article was also published as a Viewpoint by The Insurer.
For more information
If you’d like to find out more about ICMR’s data and modelling at Lloyd’s line of business level, please contact us.