Syndicates relative performance consistency essential in follow-only strategies
As follow-only strategies gain momentum at Lloyd’s, how do you identify consistent gross outperformance?
While in the past a broker would have to walk into the Lloyd’s underwriting room to find follow capacity, nowadays a risk can be placed on an online broker platform, allowing underwriters to access all the information via APIs. Still, a decision has to be made if one wants to follow a leader and offer capacity.
Past performance is still a good indicator of future performance, particularly past relative gross underwriting performance.
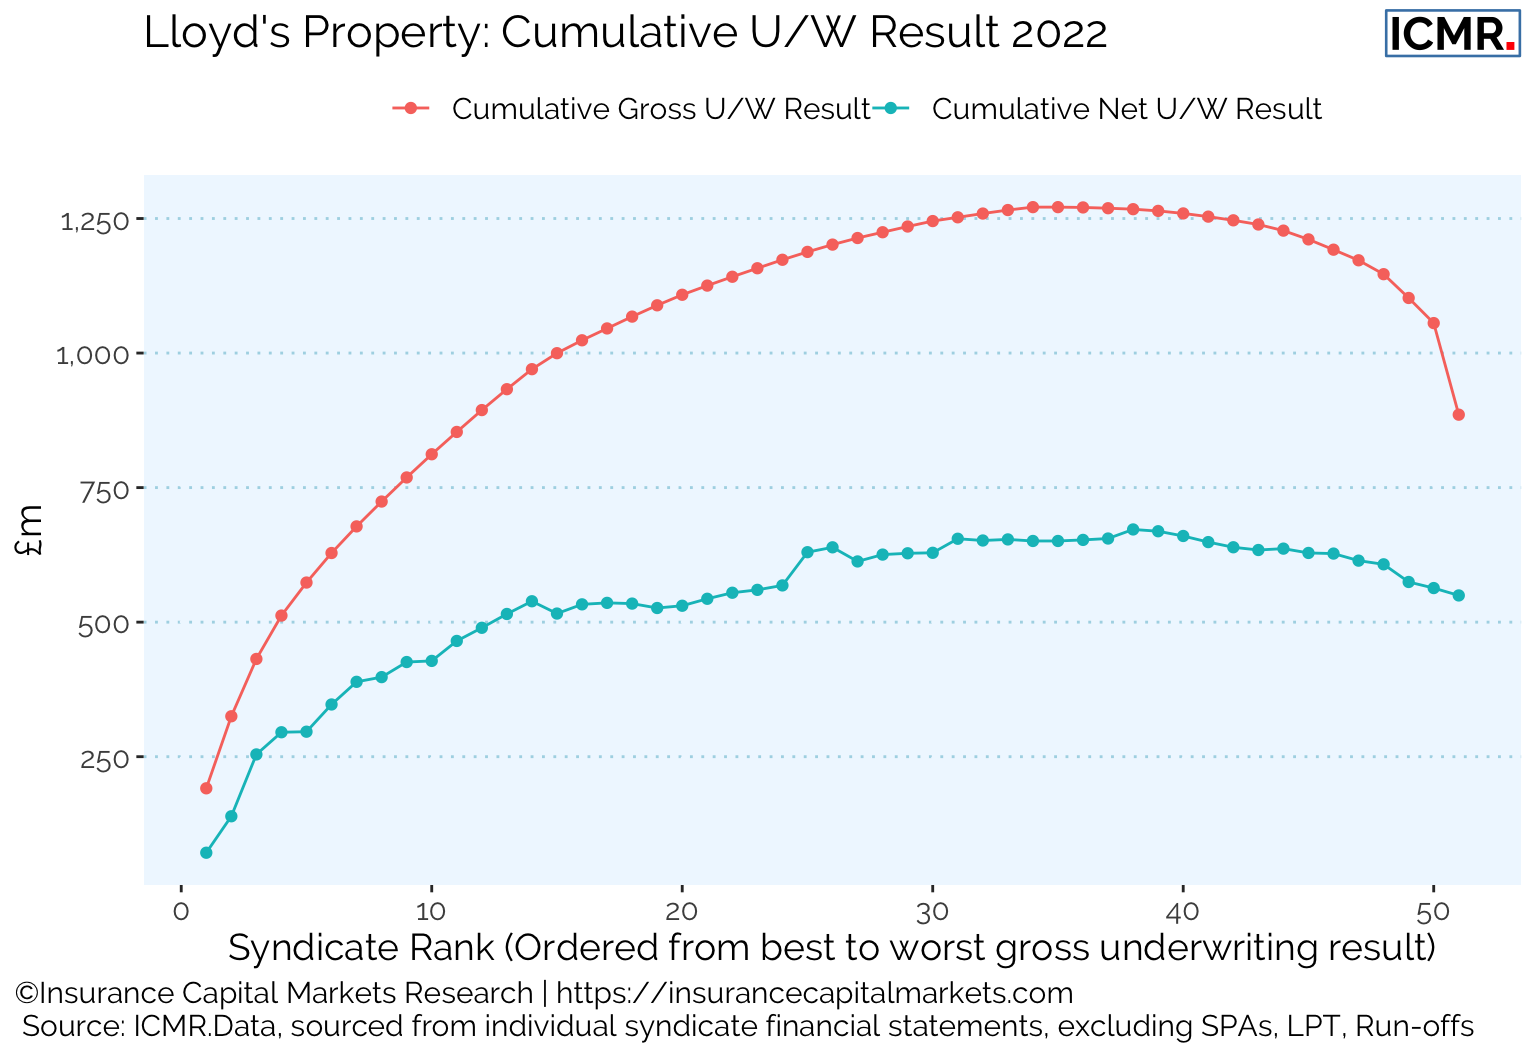
Looking at the 2022 Lloyd’s gross property underwriting results shows that only a few syndicates incurred substantial gross losses (most likely from Hurricane Ian), but the gap between gross and net underwriting result shows that many syndicates shared substantial amounts of their income with their reinsurers.
A key question would be whether a given syndicate’s result was essentially random within this distribution of performance.
However, as ICMR have demonstrated many times in other research, relative performance is much more stable than absolute performance.
A top quartile syndicate is most likely to remain a top quartile syndicate the following year and the same is true when moving from syndicates’ whole account result to their class of business results.
Consequently, it is possible to construct league tables of syndicate performance at a class of business level.
This consistency is further evidenced when looking at quartile performance transition matrices, showing over time the probabilities of syndicates maintaining their relative advantage or disadvantage year on year.
The following table shows the probabilities of staying in the same quartile for the following year or improving/deteriorating performance for syndicates writing Property business.
Property gross loss ratio performance year-on-year transition frequencies
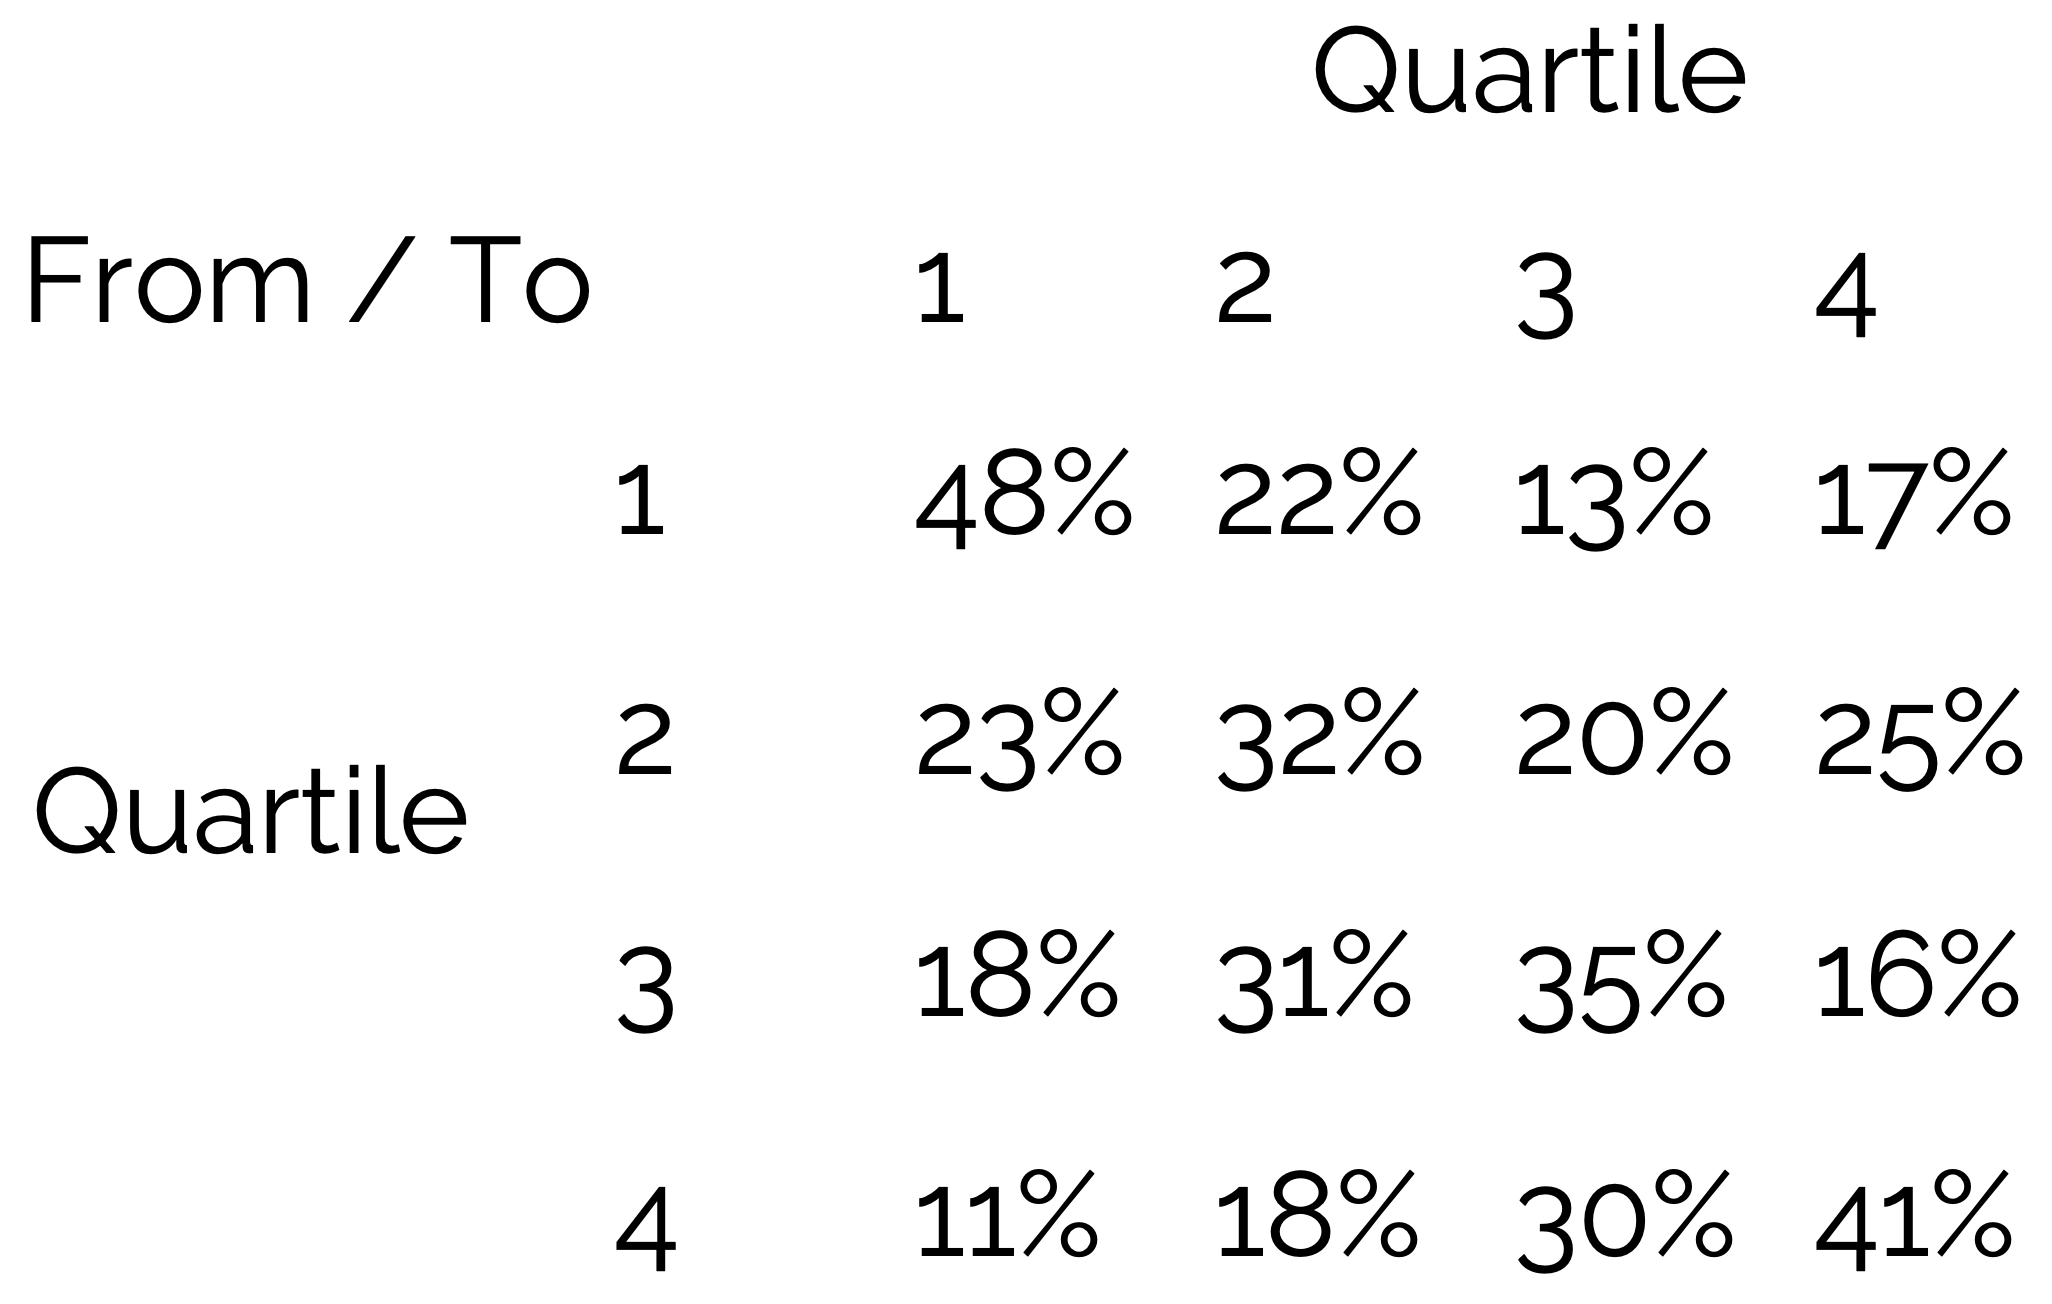
Figure 1: Average annual property gross loss ratio performance quartile transition frequencies for syndicates over the period 2015 - 2022 (excluding SPAs, SiaB, LPT, Run-offs and syndicates with GEP < £50m). Source: ICMR.Data
As the above table shows, the largest percentages are along the diagonal, meaning that syndicates are most likely to maintain their relative position year to year, rather than improve or get worse.
And this is also the case whether Lloyd’s is reporting an overall market profit or loss.
Understanding these relativities, particularly at a class of business level, is key to understanding and parameterising follow-only underwriting decisions.
This article was also published as a Viewpoint by The Insurer.