Probability of success at Lloyd’s
How follow only strategies can model data to improve outcomes
With the publication of syndicate 2023 financial statements, and ICMR’s retrieval of gross underwriting class of business performance data, the attention of many follow only propositions has turned to parameterising their underwriting models.
These will use historical performance data to form a view on which syndicates and which classes to follow for their business plans.
But the most important question is, how?
As we showed in our recent joint Lloyd’s Insights report with the LMA a range of highly volatile deterministic history doesn’t easily lend itself to reliable extrapolation, as the following example for the direct specialty segment of Lloyd’s syndicates shows:
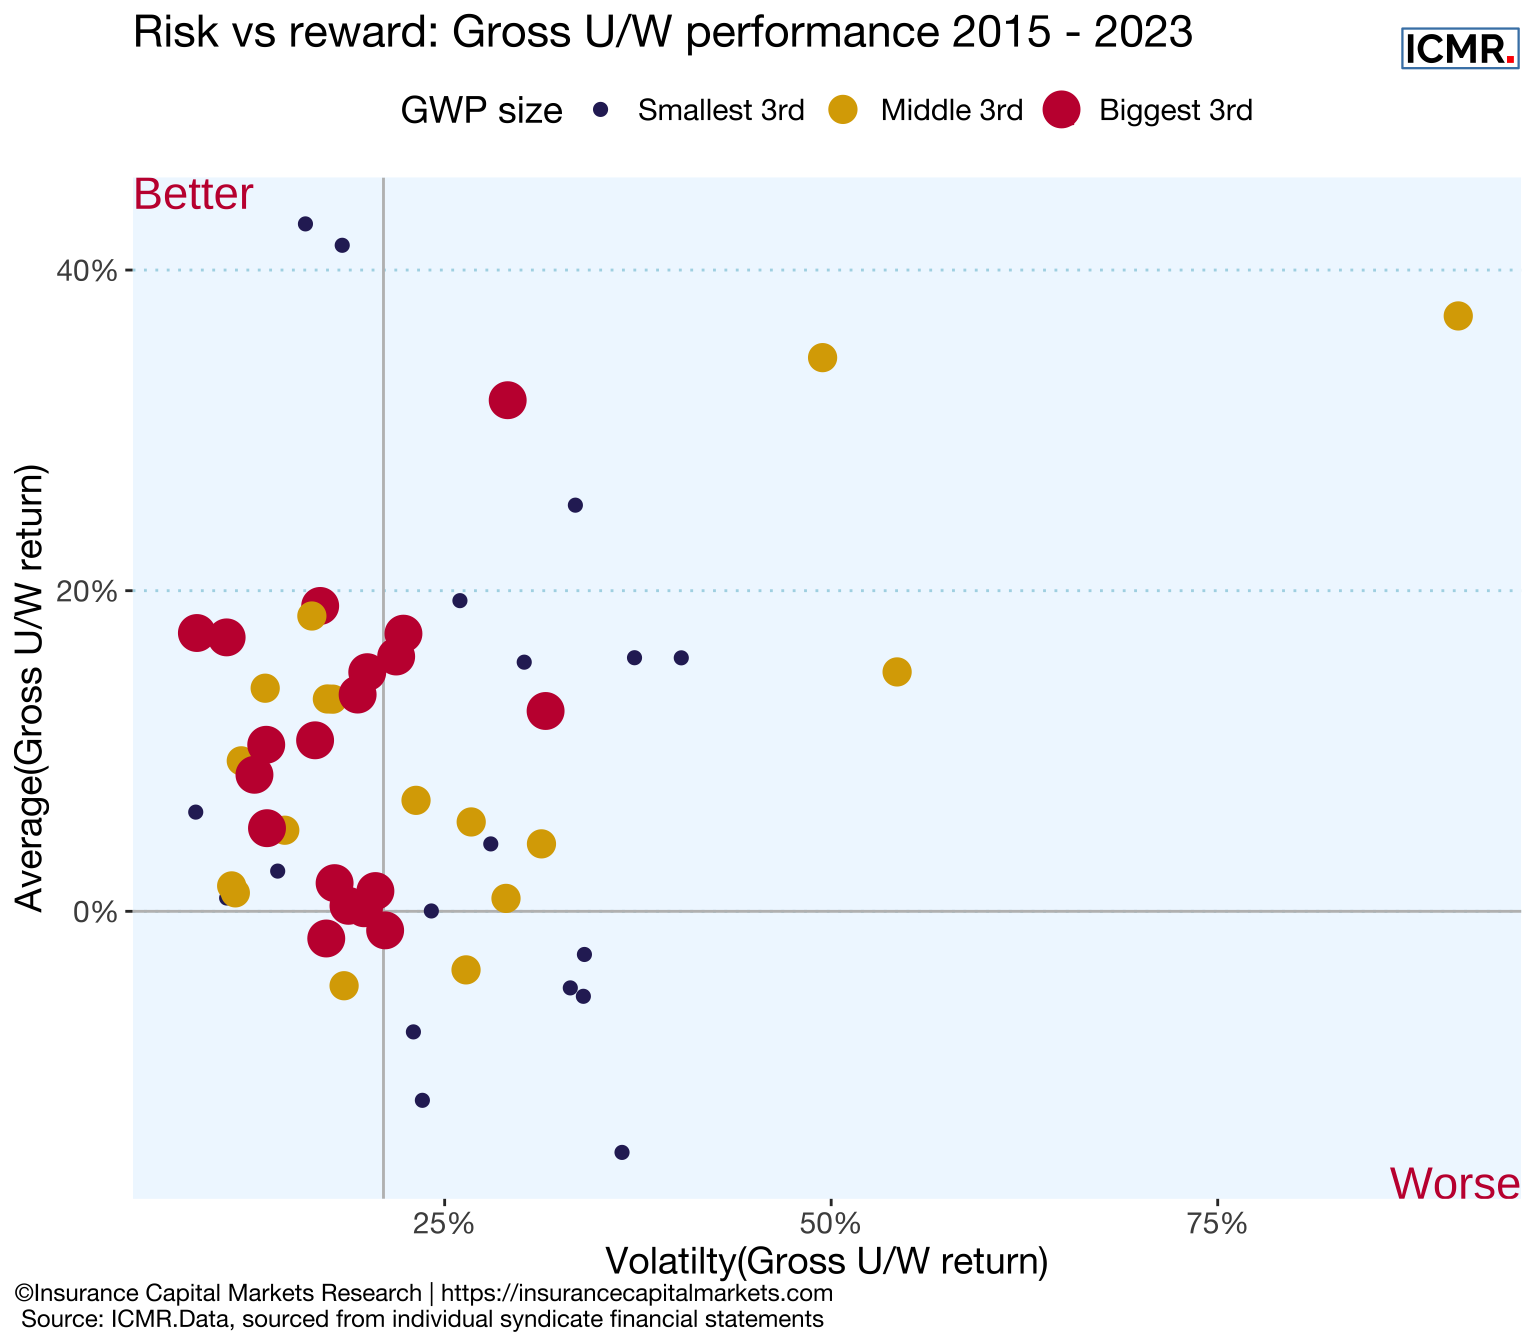
Using the latest sports modelling techniques, where RELATIVE outcome is a much more reliable indicator of form than ABSOLUTE times, we find the same attributes apply to portfolios of (re)insurance risk. This isn’t surprising as most portfolios have fairly stable books of renewal business and consistent management. Whether major claims event occur or not will naturally affect everyone’s profitability, but not necessarily everyone’s relative performance. A bit like athletes who target doing enough to qualify from heats into the final.
Applying these principles using probabilistic programming reveals distributions of how likely a given class of business within a given syndicate is to better than the Lloyd’s Market as a whole. The following chart gives an illustration for three syndicates and the lines of business they write.
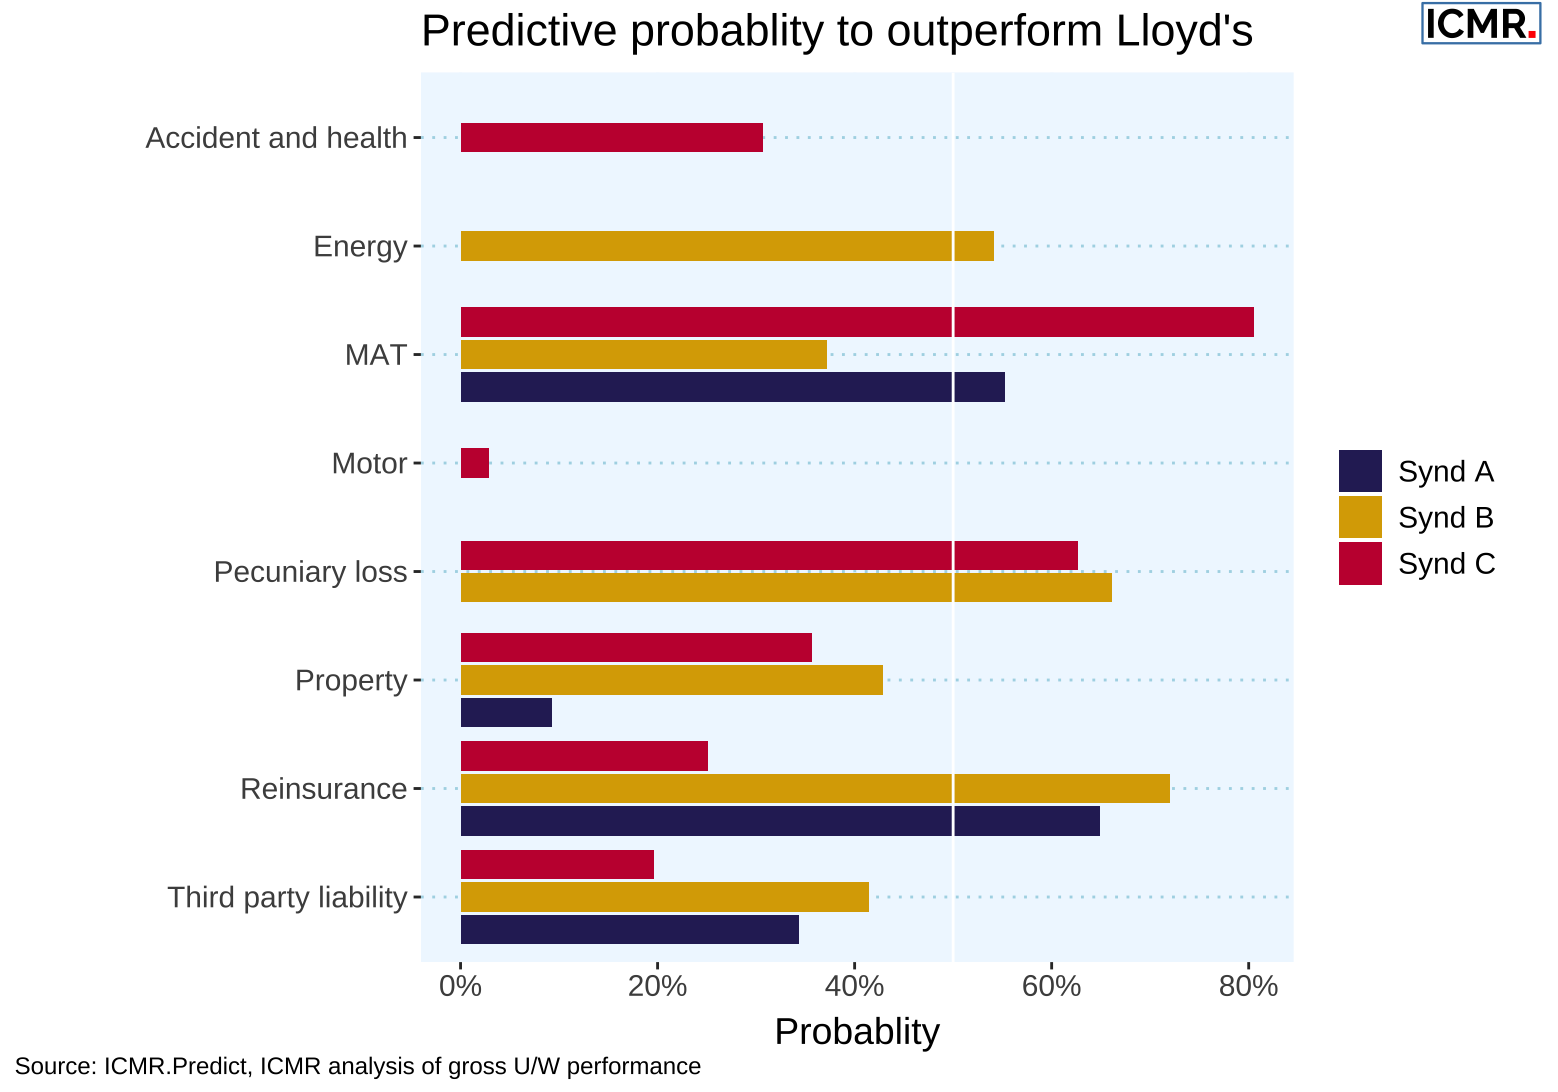
Feeding this information into follow only models, along with correlation across syndicates, can help develop more successful strategies, as well as give insight into when, perhaps, to slow up premium growth, for those targeting the gold medal.
This article was also published as a Viewpoint by The Insurer.