Lloyd's combined ratio performance distribution
Only top quartile and very few second quartile performers achieved underwriting profits in 2019.
We looked at Lloyd’s bottom line results in previous posts. Today we focus on Lloyd’s underwriting performance against its peer group and across the market.
Combined ratio performance vs peer group
We noted that Lloyd’s no longer produces comparatives in its annual results presentation, but in a spirit of continuity (and given that we originally constructed the peer groups when we were at Lloyd’s) this is the recent trend in comparatives:
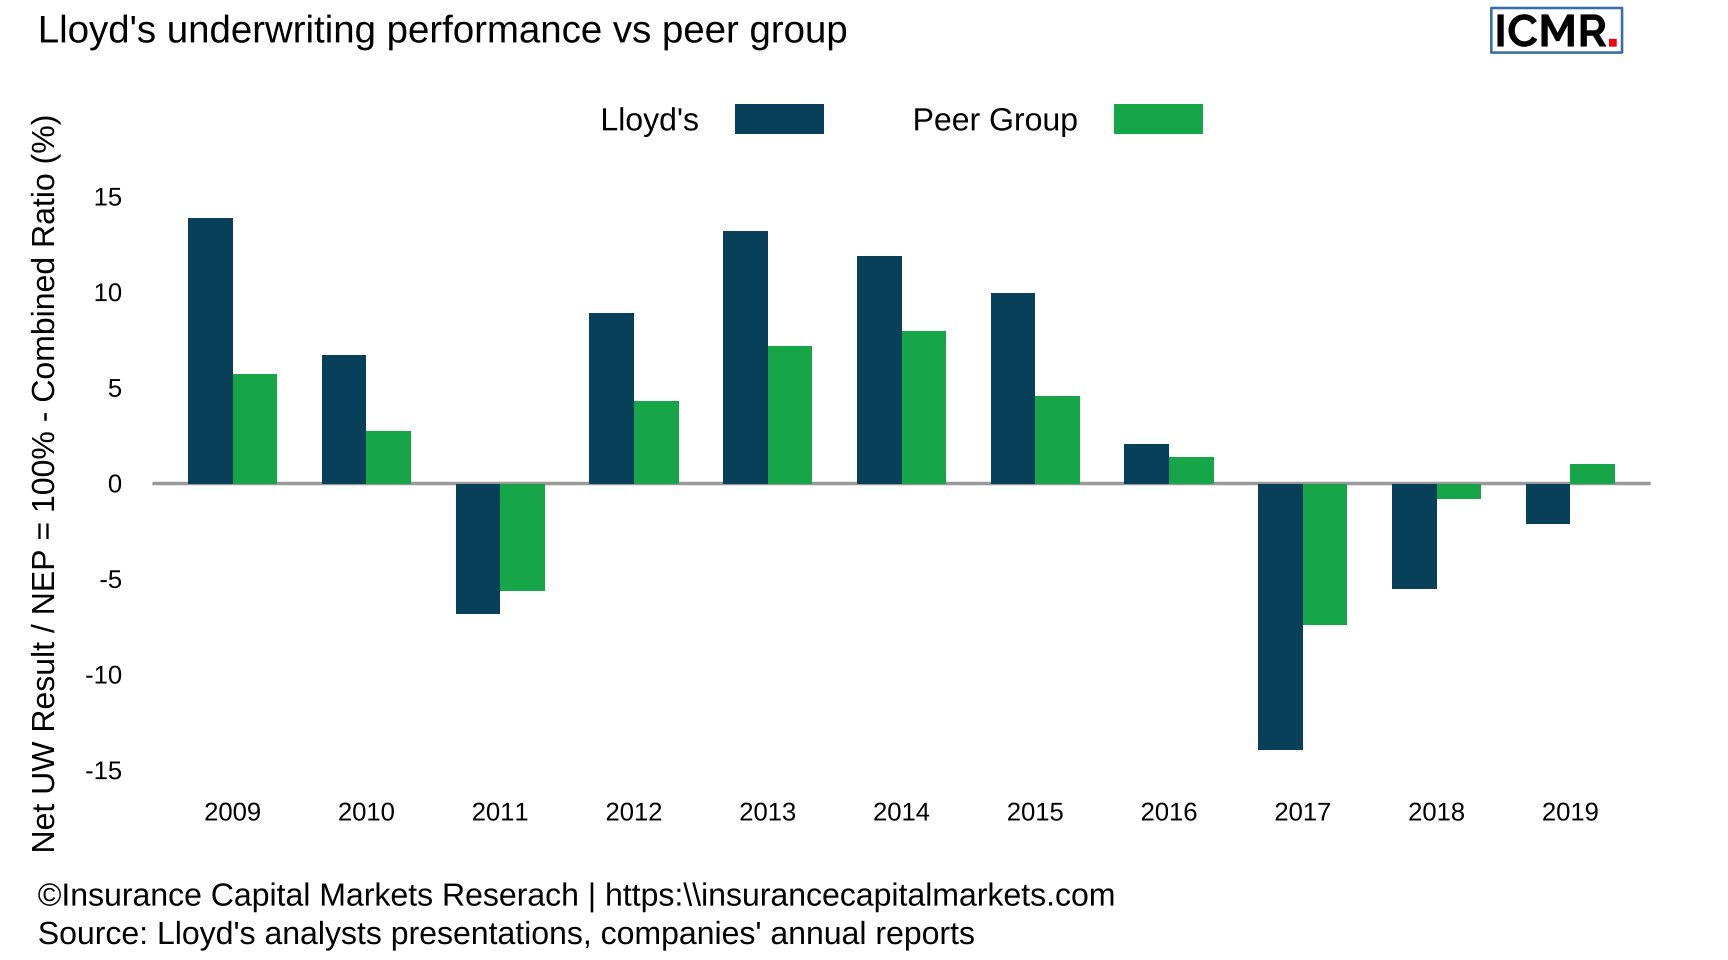
Figure 1: Lloyd’s combined ratio performance against peer group. The peer group comprises 13 companies operating in the US, European & Bermudan markets, for 2019: AIG, Allianz, Arch, Chubb, CNA Corp, Everest Re, Hannover Re, Munich Re, Partner Re, SCOR, Swiss Re, Axa XL and Zurich
Although it is now three years in a row that Lloyd’s underperformed its peer group, the performance gap is closing. The performance within the peer group is a little mixed as well, with 4 out of the 13 companies reporting combined ratios worse than 100% for 2019.
Combined ratio distribution across syndicates
Similar to the peer group, the reported combined ratio by syndicate varied as well. The following chart shows the distribution of combined ratios across syndicates from 2009 - 2019 split into quartiles.
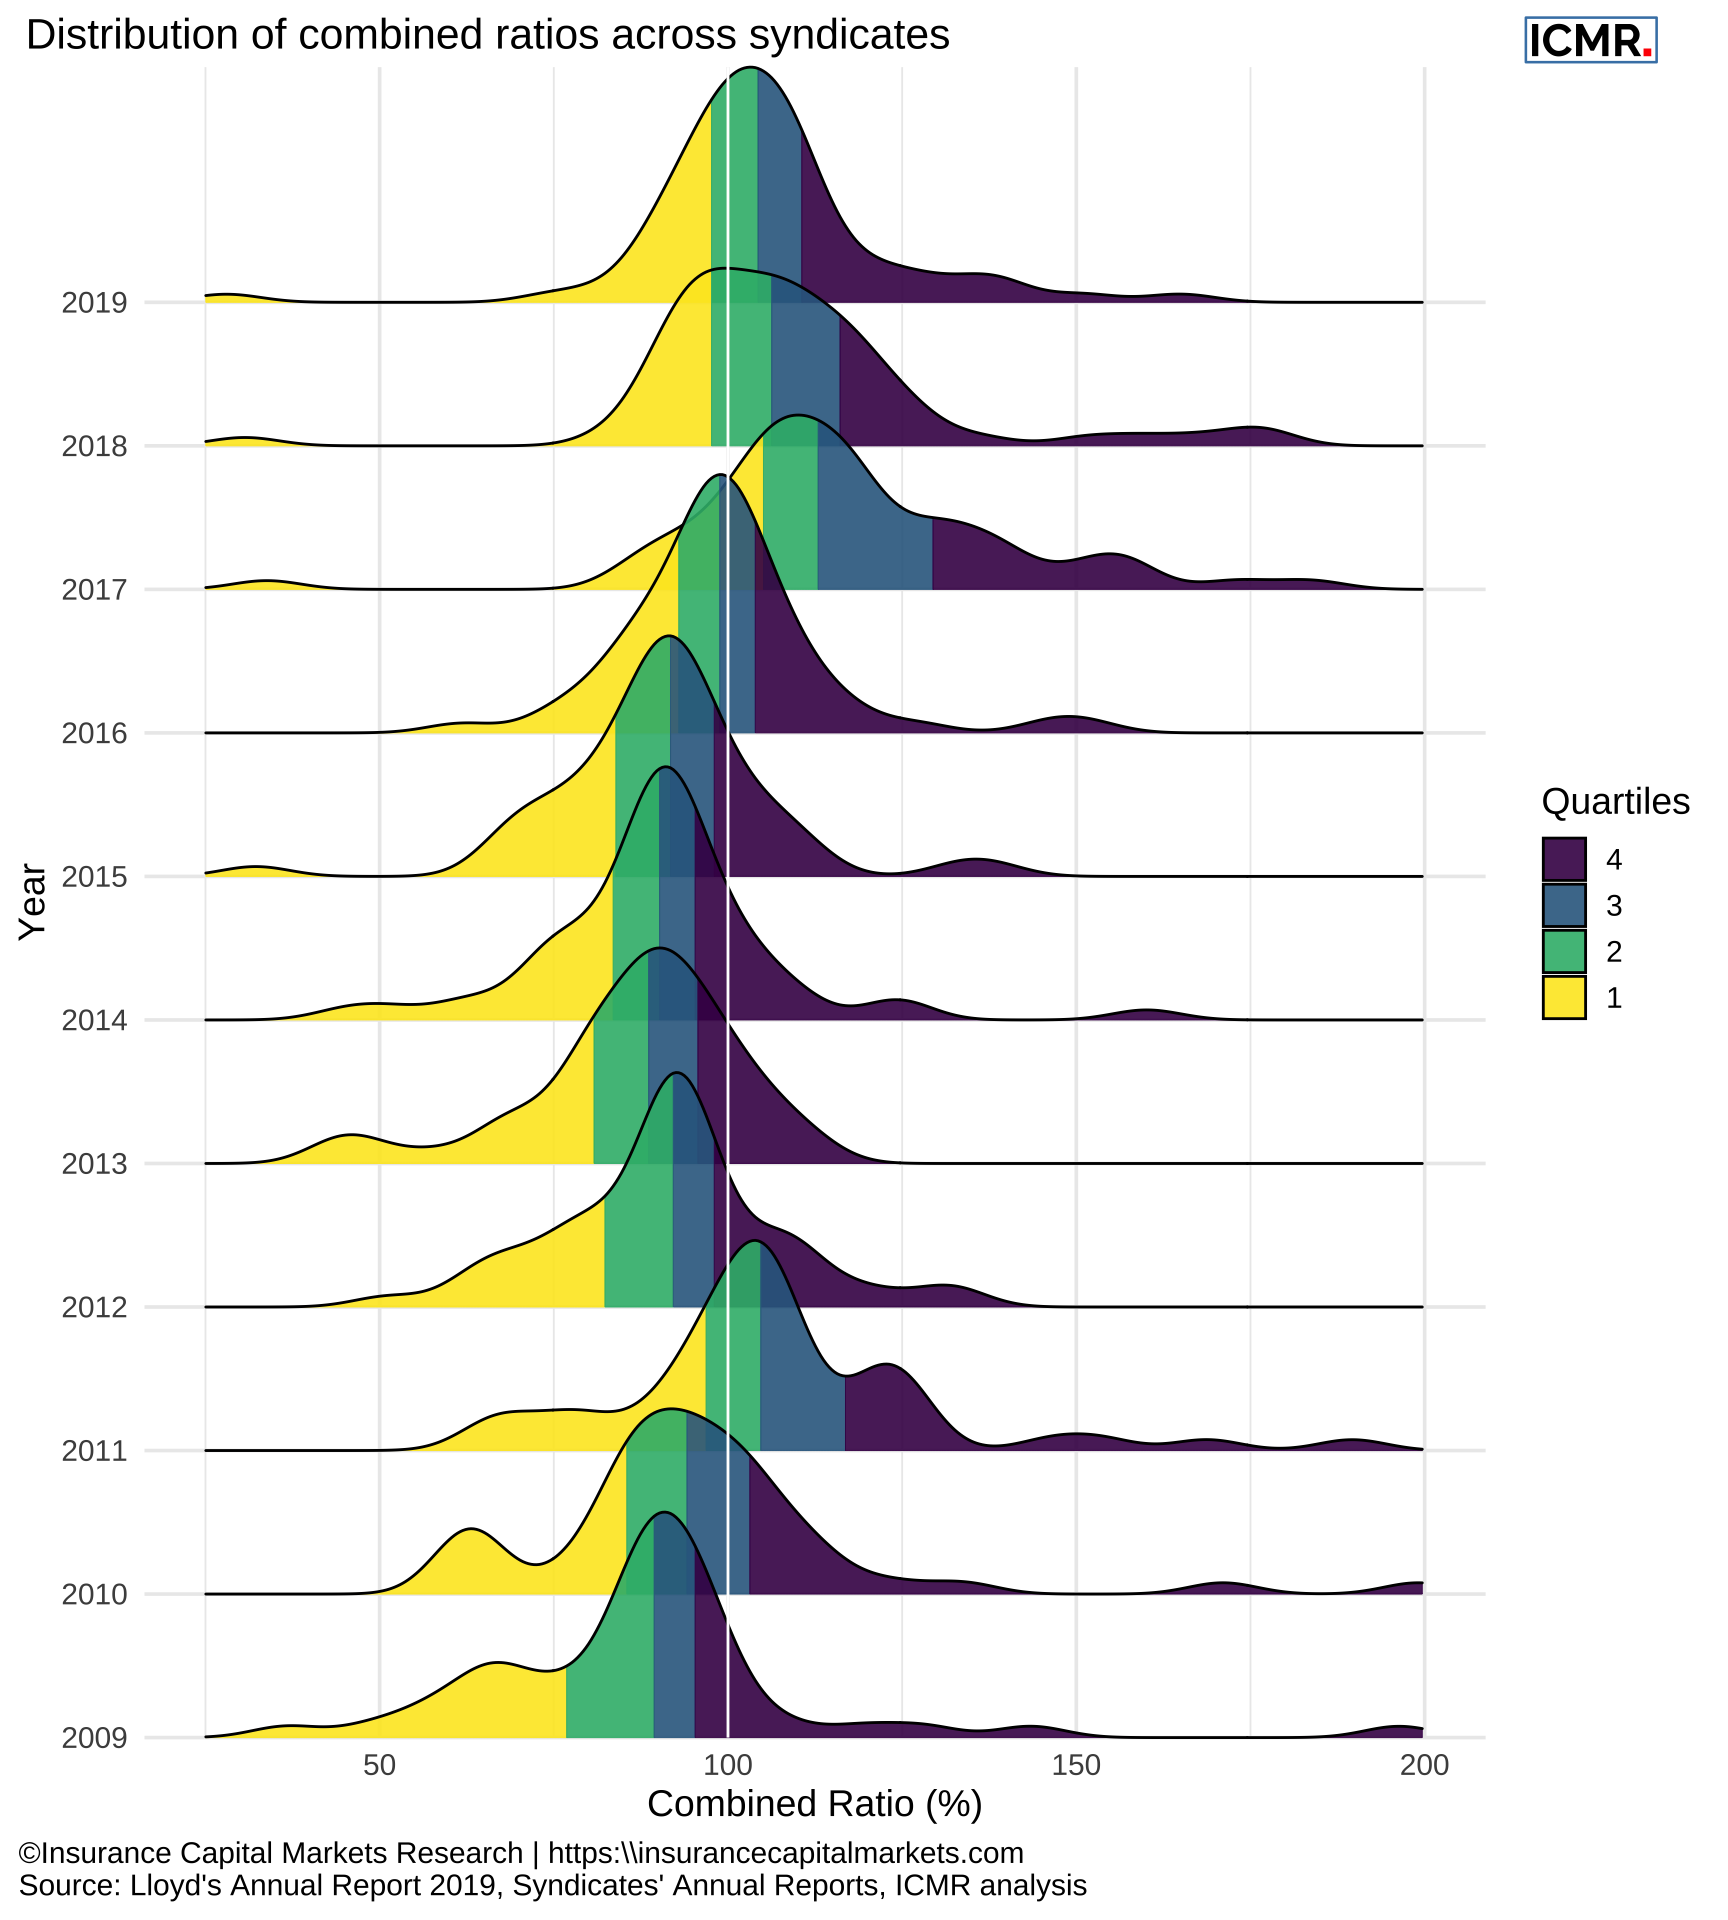
Figure 2: Distribution of syndicates’ combined ratio from 2009 - 2019. All syndicates with a number greater than 6000 (SPAs) have been excluded, as well as the first three years of start-up syndicates and syndicates that wrote less than £20m in each year. SPAs have been excluded since they are reinsurance arrangements of the host syndicate and as such don’t make underwriting decisions, the other syndicates have been excluded as their performance can be very volatile for the lack of premium volume.
What the chart illustrates nicely is the challenge of achieving underwriting profits over the last three years. Over the period from 2009 to 2016, with the exception of 2011, all top and second quartile performers reported a combined ratio less than 100%. In 2018 and 2019 only top quartile performers did so, along with a tiny handful from the second quartile.
From the chart it is easy to identify the years with little catastrophe activity versus those with catastrophe losses. Not only is the distribution shifted to the right but it also elongated across all the quartiles.