Lloyd’s return on capital: the good, the bad and the ugly
For the first time investors can review Lloyd’s syndicates’ return on capital and compare them directly with other re/insurers.
The first half of 2020 has nearly ended and it looks like 2020 will be another loss making year for the Lloyd’s market as a result of the Covid-19 pandemic, notwithstanding the remainder of the 2020 hurricane season. On the other hand the industry press reports that premium rates are hardening significantly. With business planning for 2021 starting soon, investors are looking at Lloyd’s as a potential source of attractive returns. Hiscox and Beazley have raised capital successfully already. But comparative information on syndicate returns on capital has generally not been available - until now.
At ICMR we have developed models which estimate syndicates’ capital requirements on a consistent basis, allowing our clients to better understand the performance profiles within the market.
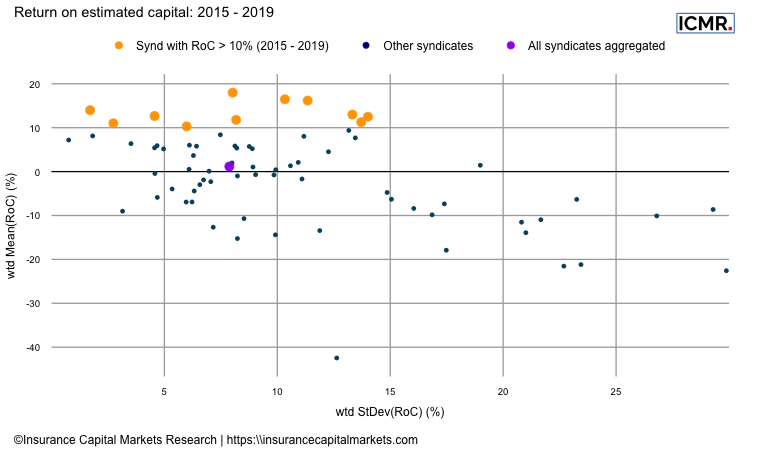
This chart shows the scatter of individual syndicate’s returns versus risk. Each dot represents a syndicate and their 5 year average return on the y-axis with the standard deviation of those returns on the x-axis, making the “quadrant of virtue” the top left. We’ve highlighted the most “virtuous” syndicates in terms of their returns on capital in yellow (the single purple dot is for the aggregated Lloyd’s market as a whole).
The scatter plot demonstrates how diverse returns on capital are in practise. If we look at the same information but over a longer time frame, an interesting pattern emerges:

This chart shows the same data but now covering a 10 year period from 2010-2019. Returns on capital have increased, as there are more profitable years to balance 2017 and 2018’s result. But interestingly, we’ve highlighted the same syndicates from the previous chart again in yellow and again, they dominate the higher-return, lower-risk part of the scatter plot. For investors, knowing the historical returns on capital for different syndicates appears to be an important guide.
ICMR developed our proprietary outside-in Lloyd’s syndicate capital model to analyse syndicate returns on a consistent basis both between syndicates and between markets. Our knowledge and experience leading Lloyd’s analytical function, as well as participation on several capital setting bodies, enables us to parametrise our models with the statistics that are the real drivers of capital at a syndicate level. Having this information may help investors new to Lloyd’s target the good and avoid both the bad and the ugly.