Review of syndicates' results 2015 - 2019
You don’t have to be big to be successful, but you can get big if you are successful.
Despite an aggregate profit of £690m across syndicates in 2019, for many of them the aggregated result over the last 5 years is still a loss. Indeed, so it is for the Lloyd’s market as a whole[^footnote]:
| Year | Aggregated Result (£m) | Cumulative Result (£m) |
|---|---|---|
| 2015 | 1,949 | 1,949 |
| 2016 | 1,353 | 3,302 |
| 2017 | -2,908 | 394 |
| 2018 | -1,373 | -979 |
| 2019 | 690 | -289 |
However, the average tells us little about the distribution of results across syndicates.
Similar to last weeks’ post we use Whale Charts again to get a better understanding of the market’s performance.
The three charts below show the cumulative result from the most profitable to the largest loss making syndicates in 2019, over the 3 year period 2017 - 2019 and over the 5 year period from 2015 - 2019. In addition we distinguish between aligned syndicates, where all capital is provided by one member and mixed capital syndicates.
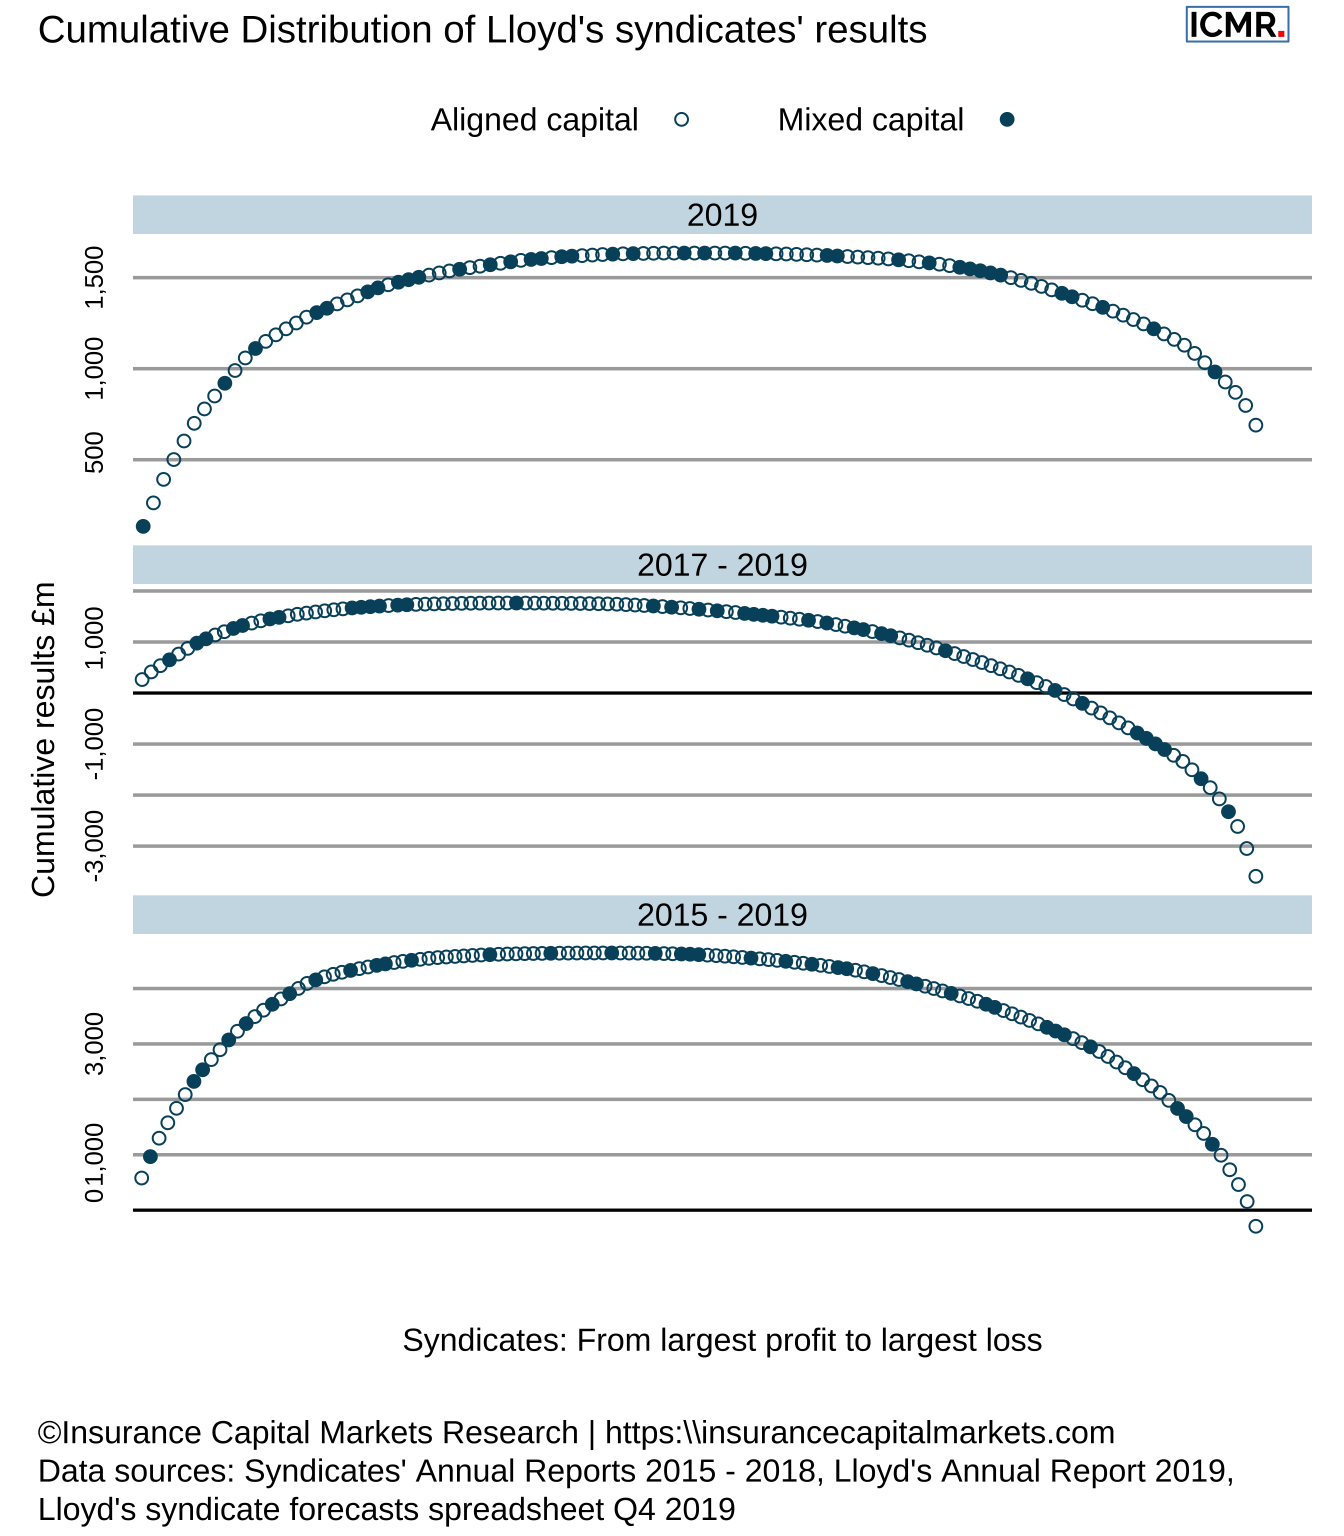
Figure 1: Whale charts of Lloyd’s results, showing the cumulative results from the most profitable to the most loss making syndicate, for the periods of 2019, 2017 - 2019 and 2015 - 2019
For the periods 2017 - 2019 and 2015 - 2019 the curves finish on the right hand side below the x-axis, indicating an overall loss. Still substantial profits were made by some, for example the 20 most profitable syndicates reported cumulative profits of over £4bn for the 5 years of 2015 - 2019. Interestingly, the source of capital, whether mixed or aligned, doesn’t seem to be a key differentiator here.
It does appear that the bigger and established syndicates weathered the challenging years better than others. Yet, it is worth emphasizing, you don’t have to be big to be successful. It is more that size can be a result of success; if you are successful and survive you can become big.
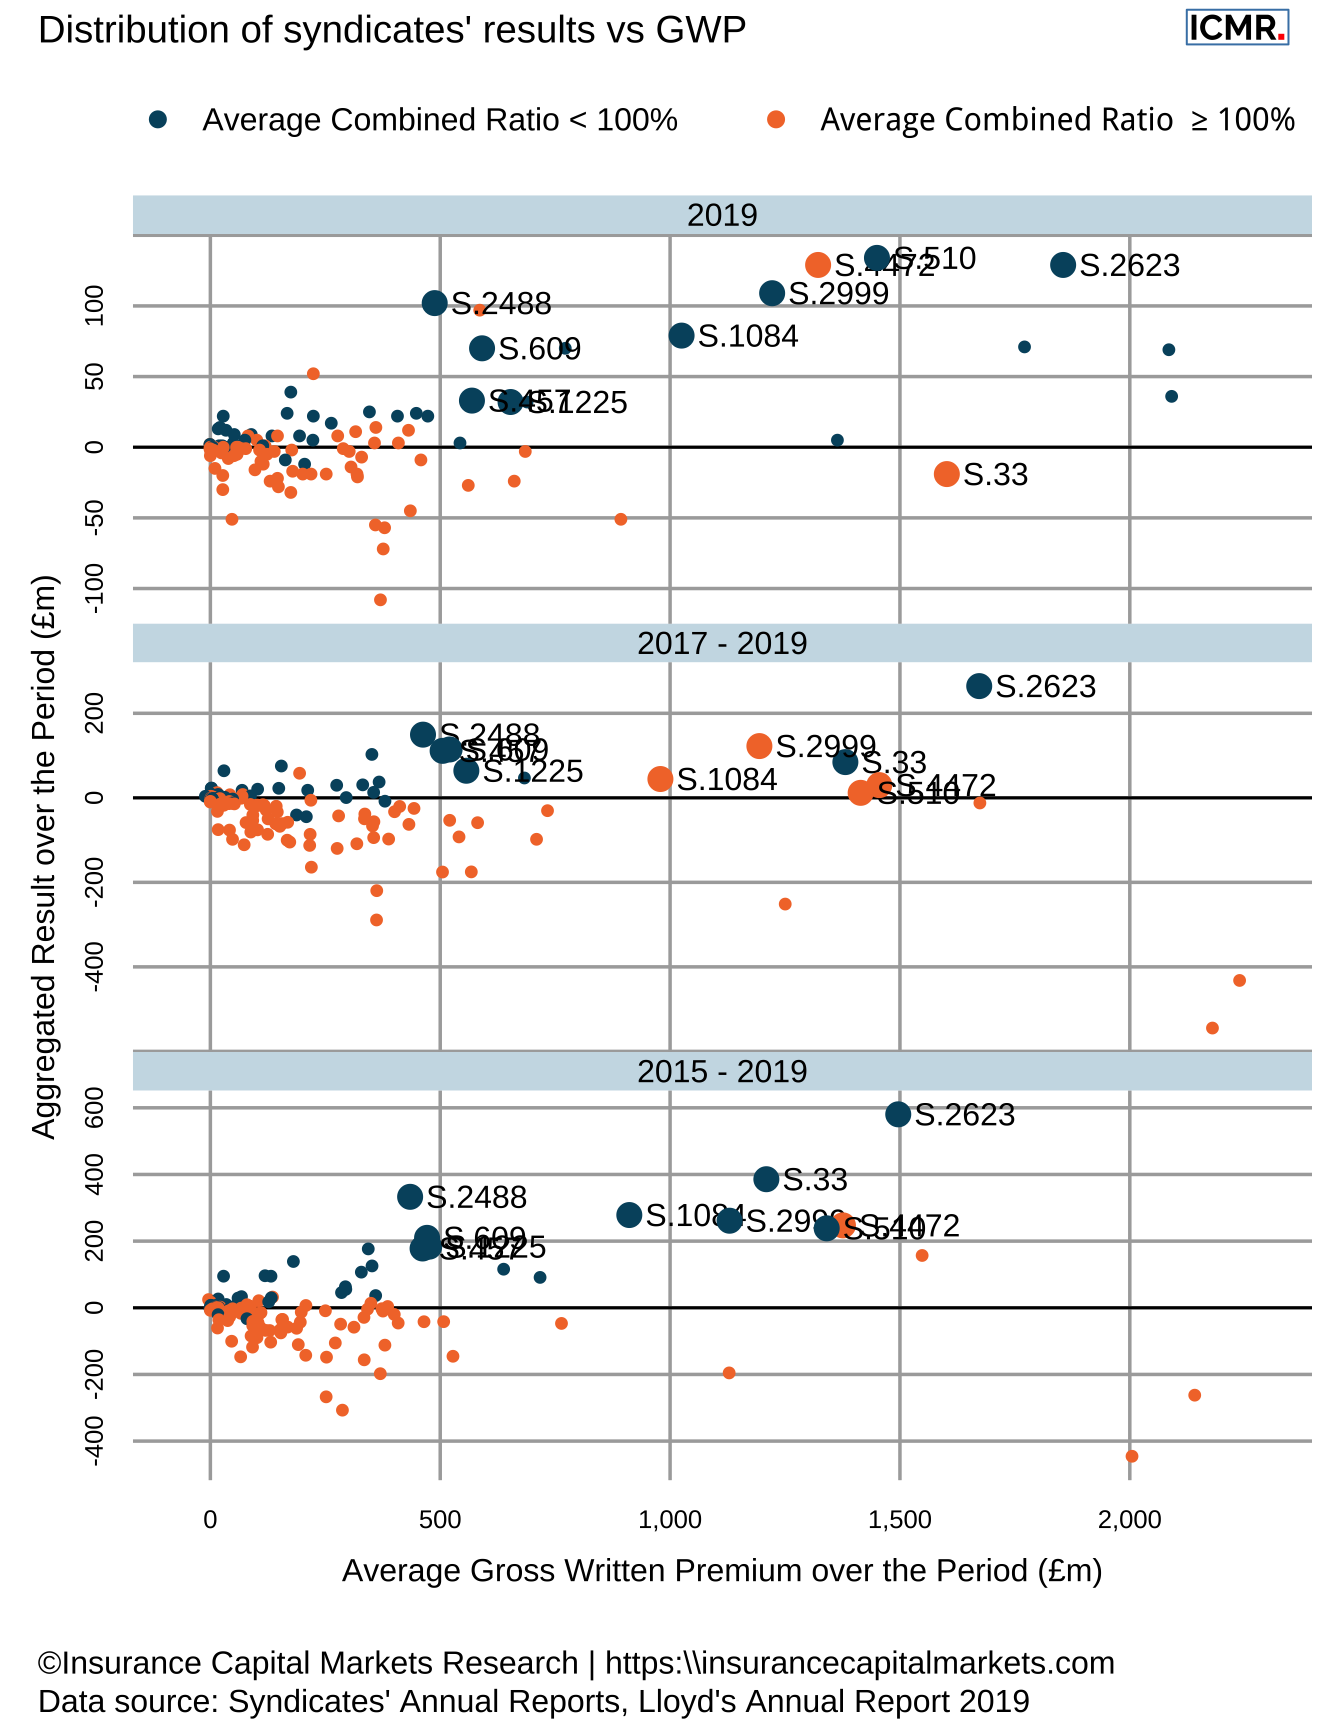
Figure 2: The top 10 profit contributors over the period 2015 - 2019 are highlighted: 2623 (Beazley), 33 (Hiscox), 2488 (Chubb), 1084 (Chaucer), 2999 (QBE), 4472 (Liberty), 510 (TM Kiln), 609 (Atrium), 1225 (Aegis), 457 (Munich Re)