Portfolio construction is crucial for new investors in Lloyd’s
Einstein was right: it’s all about relativity
For investors new to the Lloyd’s market, the ultimate goal is accretive multi-year participation in a new and diversifying asset class. All of these descriptions can present both opportunities and pitfalls; multi-year suggests the importance of building long term relationships but also stems from both complexity and illiquidity. Perhaps the trickiest obstacle for new investors in the market is the ability to demonstrate accretion of their investment. Not all syndicates will want new investors’ capital at any given time, so the first and most important challenge is portfolio construction. This is where the consistency of relative performance, and thereby relative returns, becomes paramount. As ICMR has argued before, relative performance and capitalisation can be predicted.
Comparing hypothetical new investor portfolios over a 5 year investment time horizon, each with different proportions of syndicates with consistent relative performance are shown below in terms of the expected investor IRR uplift:
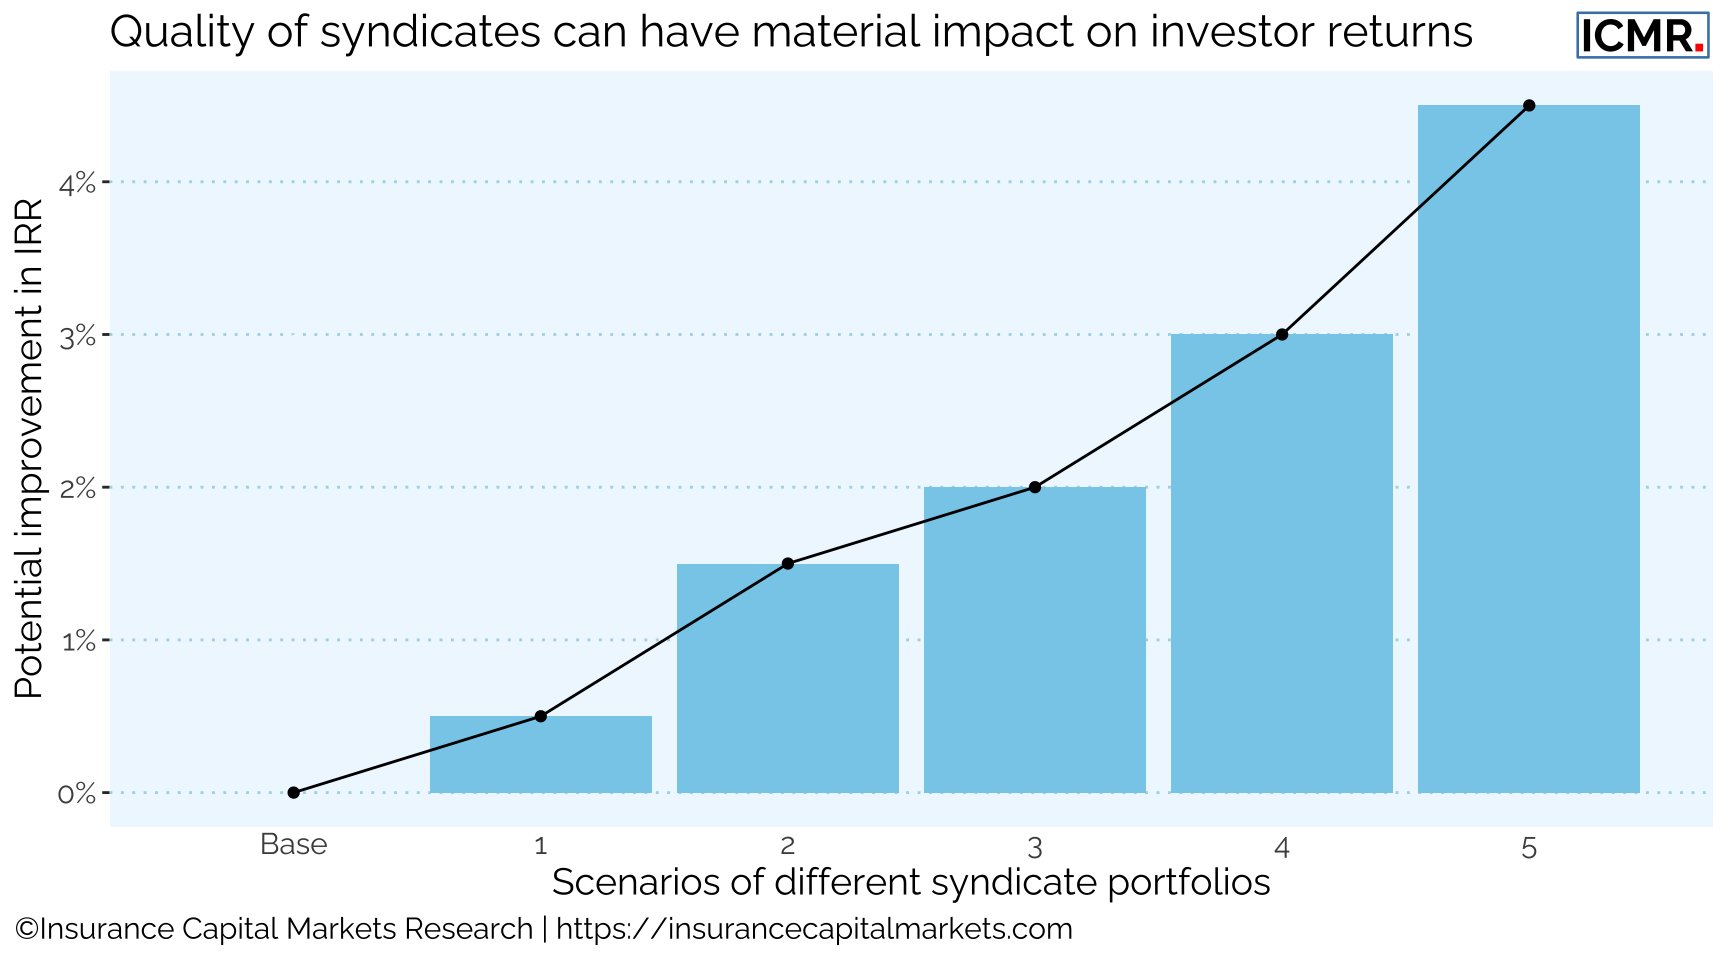
These hypothetical portfolios comprise syndicates looking for investors and do not comprise any syndicates where investors would have to purchase freehold capacity at the annual capacity auctions. Consequently, we believe this offers a realistic estimation of the range of IRR uplift available to new investors who understand the data from only a small portfolio of syndicates. (NB - significant major claims have not been factored into future projections; underwriting returns are assumed to erode over time; syndicate investment returns are assumed to decline with reductions in interest rates over time).
With such a diverse range of outcomes available to new investors, data is key. The following chart illustrates for one syndicate how consistency of superior relative performance can be demonstrated:
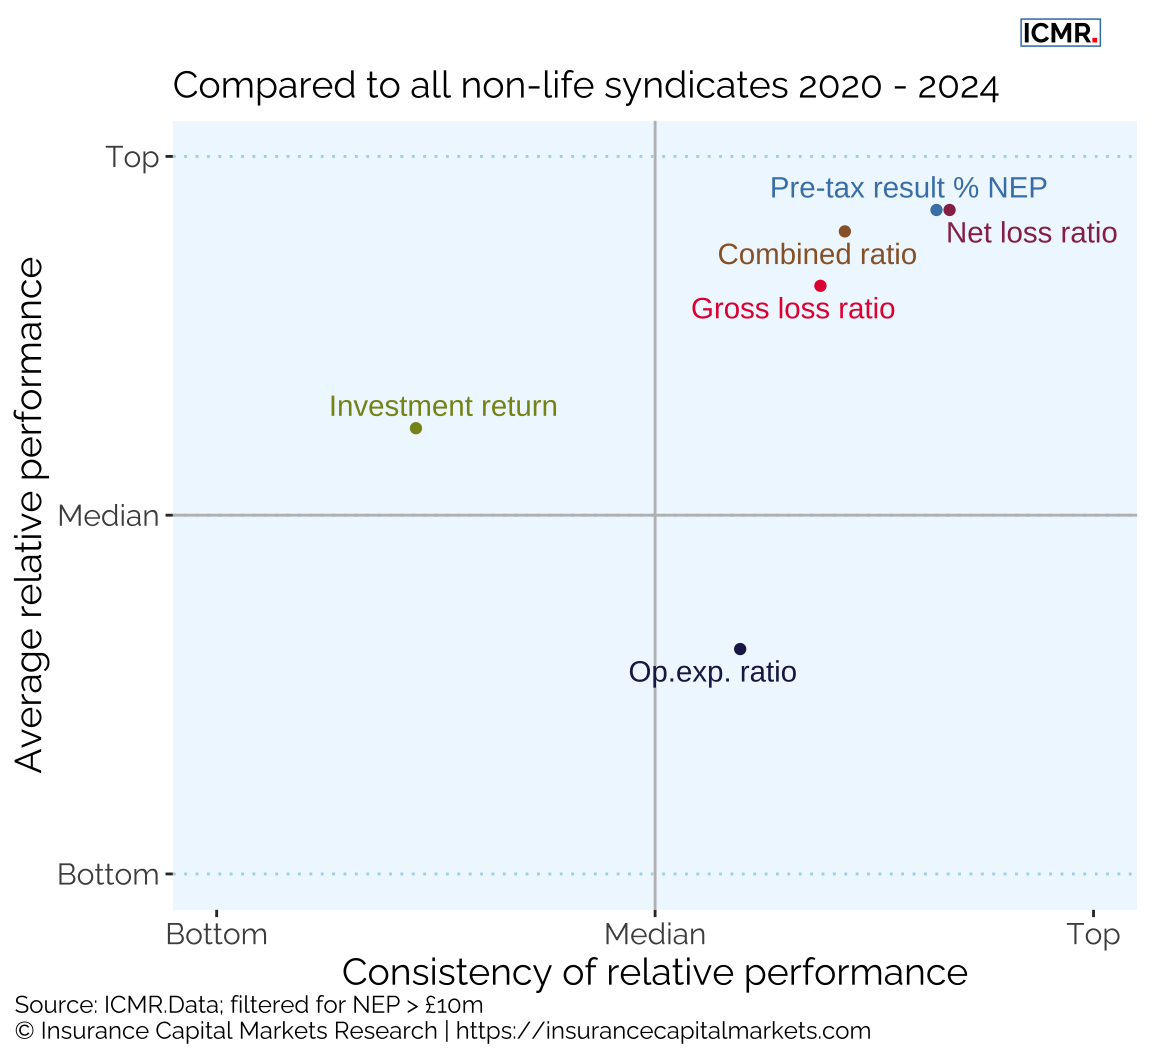
The above chart is a quadrant plot which shows the relative position of each calendar year GAAP metric to all other syndicates in respect of their relative aggregate performance over 5 years and their relative volatility of annual performance, eg:
- Gross loss ratio (= Gross incurred claims / Gross earned premium)
- Net loss ratio (= Net incurred claims / Net earned premium)
- Expense ratio (= Operating expenses / Net earned premium)
- Combined ratio (= (Net incurred claims + Operating expenses) / Net earned premium)
- Investment return (= Investment income / Financial investments)
- Pre-tax result % NEP (= Pre-tax result / Net earned premium)
This relativity can be very narrow or wide depending on the metric. (NB - this approach normalises the various KPIs to make them comparable).
Syndicates in the top right have consistently outperformed the market with low annual volatility, while syndicates in the bottom left under-performed on an aggregate basis with highly volatile results over the years.
The above illustration comes from ICMR’s and Helios Underwriting’s new book, Syndicate Statistics, a review of Lloyd’s performance 2025. The book presents a detailed analysis of every Lloyd’s syndicate, based on the 31 December 2024 calendar year results. All Lloyd’s related data contained within the book has been gleaned from published financial statements of Lloyd’s and its constituent syndicates.
The book is only available in hard copy, while the underlying data (ICMR.Data) can be purchased separately.