Lloyd’s returns are uncorrelated with capital markets, right?
The ICMR NAV Index reveals the reality of Lloyd’s correlation for insurance investors.
For investors attracted to the Lloyd’s market, the ultimate goal is accretive multi-year participation in a diversifying asset class amongst a mixed portfolio. One of the key advantages of Lloyd’s is its perceived lower correlation with other asset types, particularly broader capital markets indices. After all, it is always assumed that catastrophe claims events are not subject to capital market metrics. But all may not be quite as clear cut.
When calculating the correlation of Lloyd’s returns against broader assets, one important factor is that Lloyd’s only publishes its aggregate results once a year, with a high level half-year update.
What difference would it make if investors were to able compare Lloyd’s returns on a much more frequent basis against the same basket of broader investment metrics?
On the 29th of June this year, ICMR announced the launch of the new ICMR NAV Index, which answers this very question. So does this reconfirm the very low levels of correlation enjoyed by Lloyd’s investors?
Well, yes and no.
A Market First: Revealing the Monthly NAV
For the first time, the market does not have to guess. The ICMR NAV Index was developed to track the monthly Net Asset Value (NAV) delta for the Lloyd’s market as a whole.
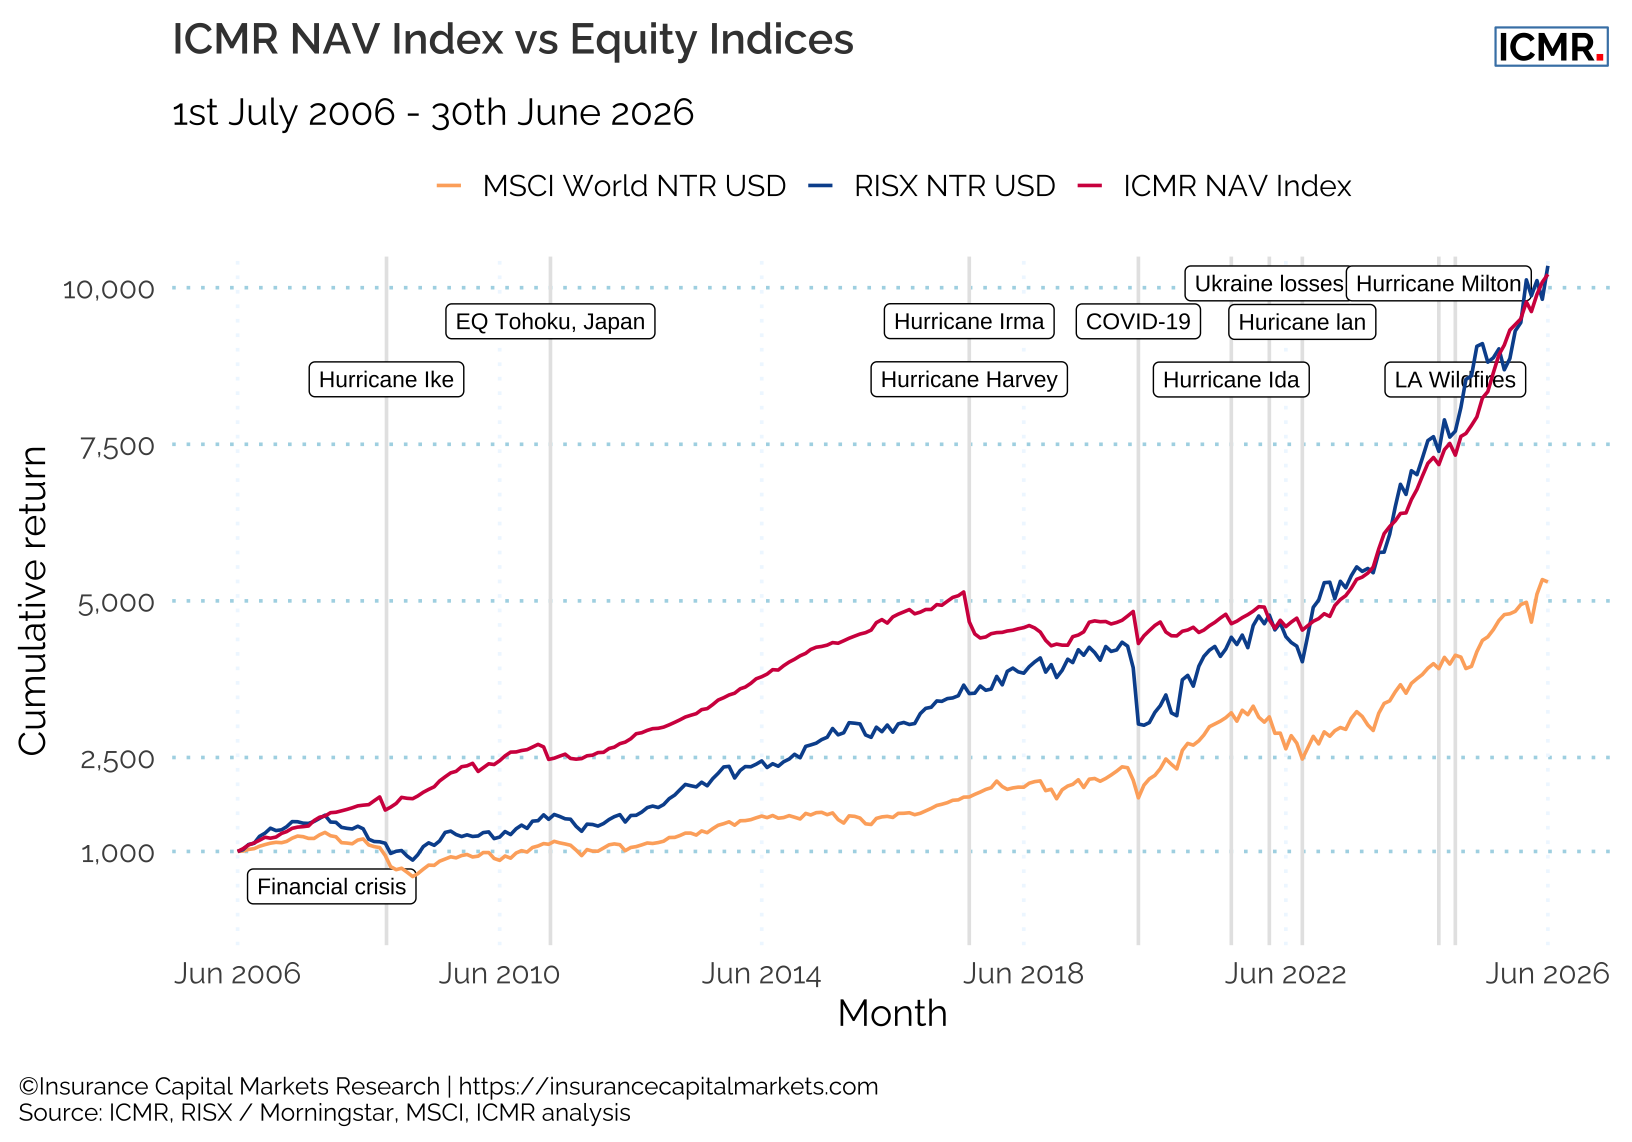
Figure 1 shows the last 20 years of Lloyd’s aggregate returns, interpolated on a monthly basis and rebased to a unit of 1,000 as of July 2006, together with a global equity index (MSCI World equity index) and ICMR’s RISX equity index, a proxy for Lloyd’s as if it were a single listed company, both also rebased to 1,000 at July 2006.
Now we can observe the build up of the monthly cumulative Lloyd’s result over time, effectively revealing the monthly NAV delta for the Lloyd’s market as a whole (taking into account Lloyd’s growing capital base)1.
This is the sum of the anticipated profit earned plus the investment return made on the float and on Funds at Lloyd’s each month, adjusted for known major claims and investment events in the months in which they occurred.
The methodology remains consistent with the detailed NAV methodology ICMR uses for a number of fund clients participating on portfolios of Lloyd’s syndicates.
There appears to be more correlation between Lloyd’s and the ICMR RISX equity index, but less between either of those and the MSCI World equity index.
Challenging Conventional Wisdom
When we examine the rolling 5-year monthly return correlation between Lloyd’s newly revealed monthly returns and the global equity index, the data challenges long-held market assumptions, see Figure 2.
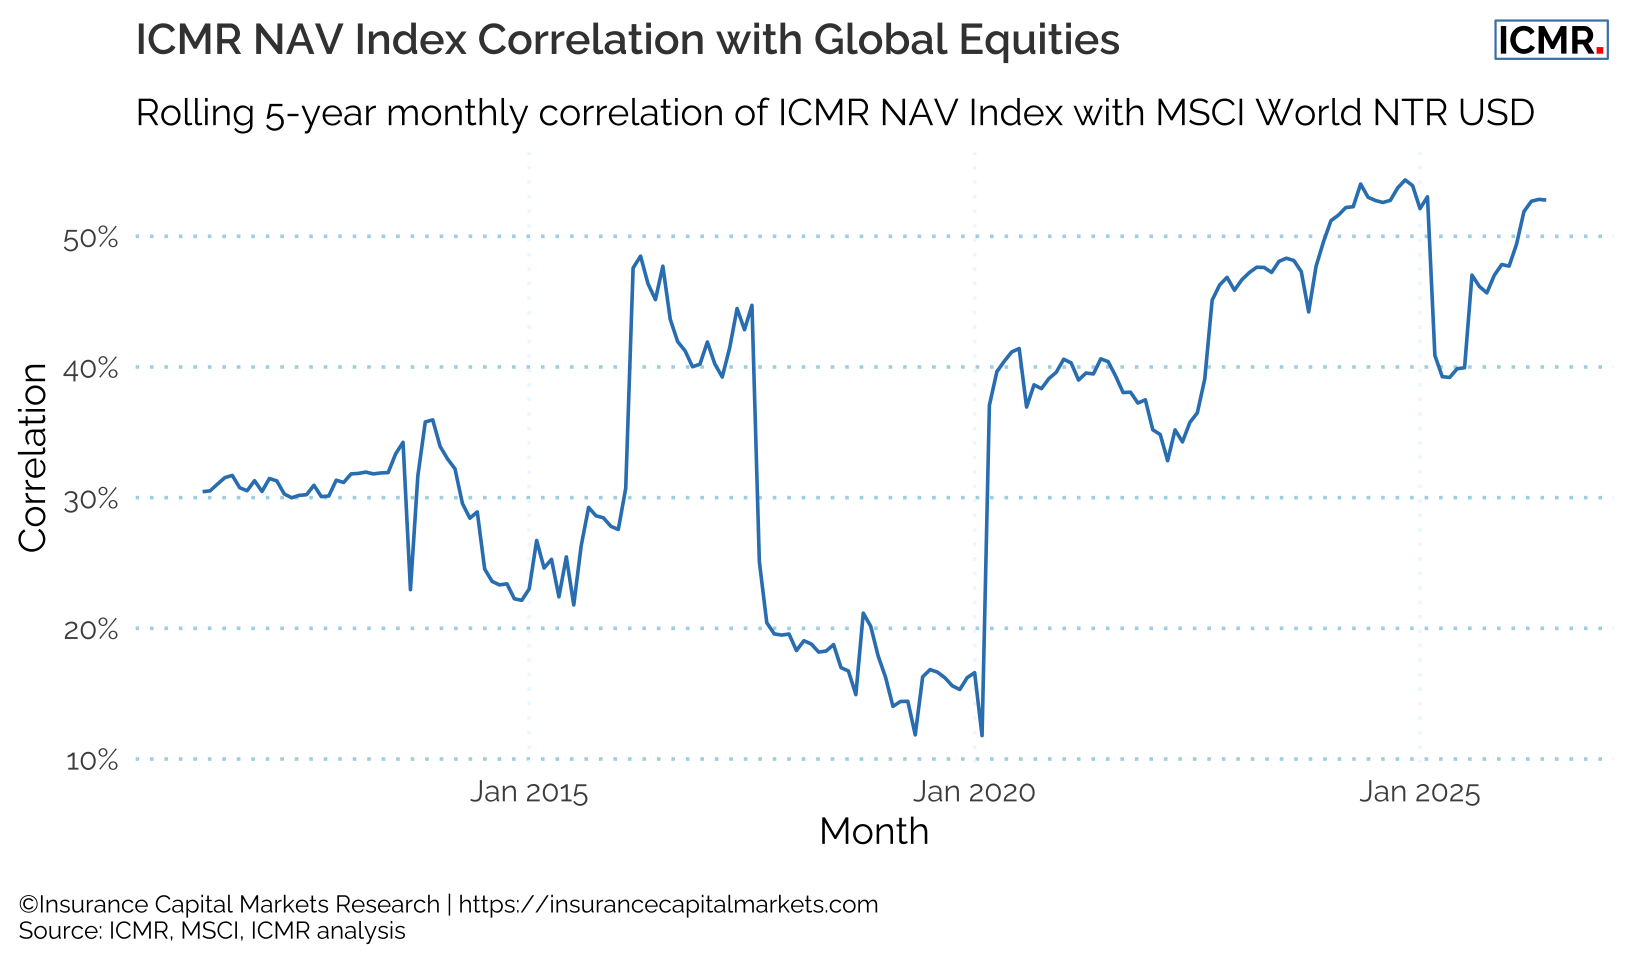
Lloyd’s certainly offers valuable diversification, but perhaps not to the absolute degree many presume. Our monthly data reveals that correlation actually fluctuates significantly, typically in the range between 20% and 50%, and is currently sitting at the upper end of that spectrum. Notably, periods of the lowest correlation have coincided with stagnation in Lloyd’s results, for example the flat NAV period in the run-up to COVID-19, which occurred against a backdrop of positive capital market returns. Likewise, Lloyd’s recent highly profitable years have seen correlation at cyclical highs.
If absolute zero correlation were an investor’s sole objective, capital would simply flow exclusively into Cat bonds. Instead, Lloyd’s provides diversification that is deeply tied to the underlying business dynamics of insurance rather than an inherent, magical immunity to wider economic forces.
The Goldilocks Zone Requires Precision
Lloyd’s remains the ‘Goldilocks’ of diversifying insurance investments, a compelling balance where correlation runs not too hot and not too cold. However, the temperature difference between varying insurance investments is highly nuanced.
To truly capitalise on this asset class, investors can no longer rely on retrospective, annual snapshots. Managing a modern, multi-asset portfolio demands true transparency and regular, robust monthly NAV reporting. With the ability to track monthly performance now a reality, relying on anything less means navigating the market with outdated information.
Equip Your Portfolio for the Modern Market
- Index Access: The RISX equity index is available on risxindex.com, Morningstar, Bloomberg and Refinitiv. The ICMR NAV Index is a proprietary tool and the data is not available in the public domain. For access to ICMR’s investor reporting services, please contact ICMR directly.
- Portfolio Review: Gain an unvarnished view of syndicates’ historical performance on an absolute and relative basis, including a prospective view on future relative performance to optimise your allocations. Learn more about ICMR’s predictive engines.
- The 2026 ICMR Syndicate Statistics Book: Go beyond simple reporting with our comprehensive 272-page book. It provides a forensic analysis of every active Lloyd’s syndicate, condensing complex financial statements into highly digestible, two-page snapshots. Purchase your hard copy directly from the ICMR website.
- ICMR.Data: The Syndicate Statistics book is the snapshot; ICMR.Data is the engine. Gain unique access to every Lloyd’s syndicate’s whole account and gross line of business underwriting performance in a single Excel workbook, and leverage our proprietary ability to model unpublished capital requirements.
Contact ICMR today to discover how our quantitative insights can support your investment strategy at Lloyd’s.
Footnotes
Figure 1 interpolates Lloyd’s pro forma results, including investment returns on Funds at Lloyd’s and syndicates as well as reported large losses at the date they occurred. Each monthly increment represents the monthly percentage change in earned profit as a function of a rolling 12-month average of Lloyd’s Net Assets comprising Funds at Lloyd’s, Members Balances, Central assets and the previous month’s earned profit/(loss). Total returns on capital will differ slightly from Lloyd’s annual reported returns due to this earning over a 12 month period.↩︎