8 Valuation and Value Creation
Although Lloyd’s does publish pro-forma accounts to represent what the market performance would look like if it were a company, many other aspects of a publicly listed company are missing, particularly around value deltas and value creation from a capital markets perspective.
8.1 A capital markets proxy for Lloyd’s
ICMR created the RISX equity index, as an investment benchmark for the (re)insurance specialty industry with a particular focus on investment at Lloyd’s.
Top 10 RISX constituents
The index is based on the publicly listed global carriers who own managing agencies within the Lloyd’s market and who currently control over two thirds of Lloyd’s premium and capital. These companies have then been weighted to reflect Lloyd’s aggregate risk profile such that the index weighted combined ratios and returns on capital mimic those of the Lloyd’s market as a whole.
In this way the RISX equity index provides a relevant, real time, liquid comparative for capital markets’ views on Lloyd’s aggregate performance. More information on the index can be found at https://risxindex.com.
Using parameters derived from this index of listed companies allows for outside-in valuation analyses of unlisted illiquid entities such as Lloyd’s syndicates, with the presumption that they are discrete standalone entities, which of course not all are.
The following two charts, Figure 8.1, Figure 8.2, demonstrate the closeness in performance of the reported premium weighted RISX portfolio and Lloyd’s reported pro-forma results. Lloyd’s results tend to be slightly more volatile but with better results in years with benign major loss activity.
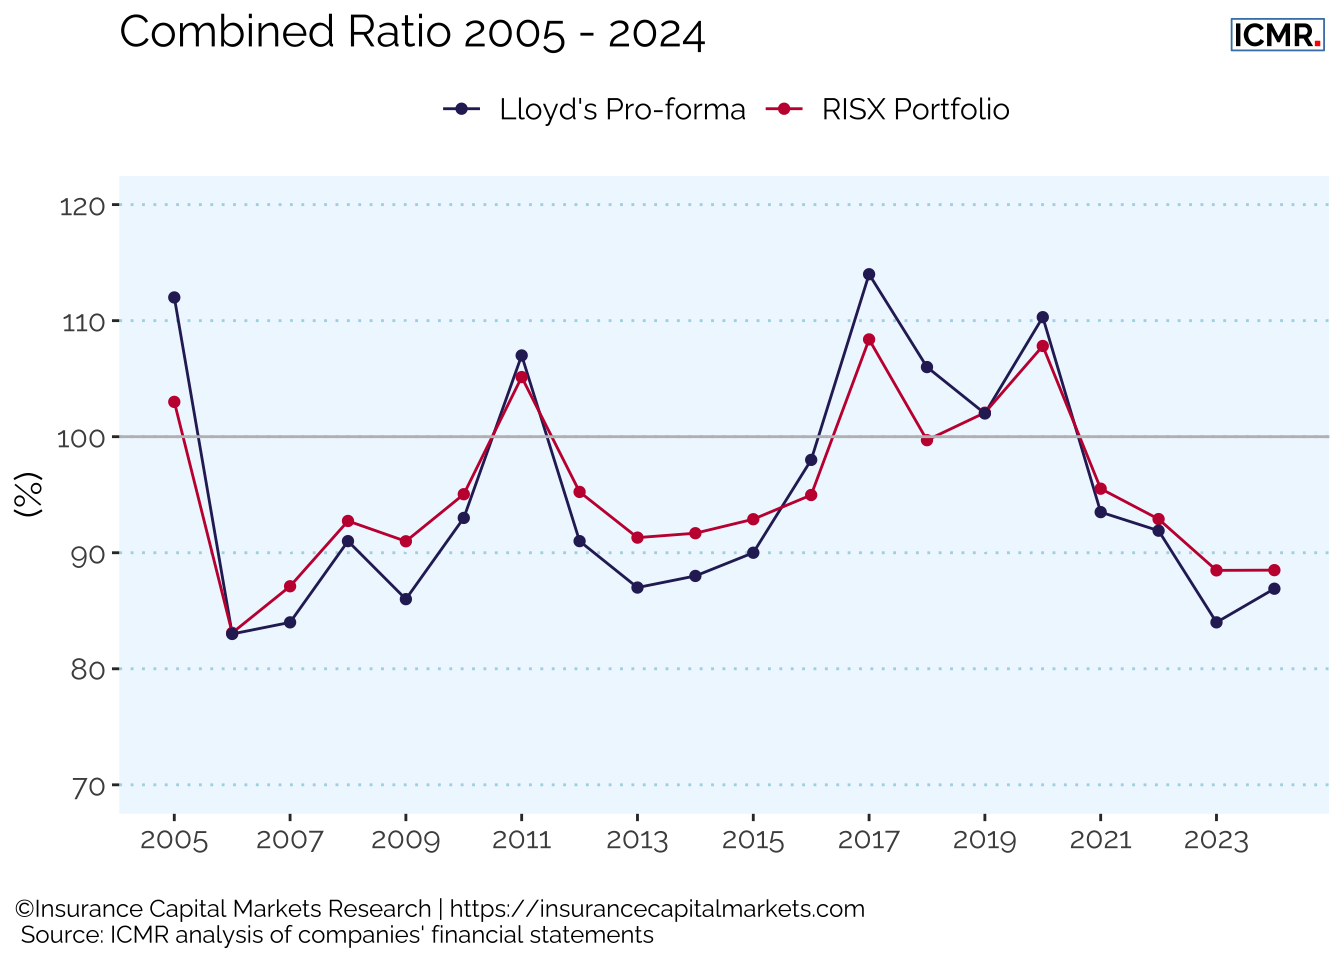
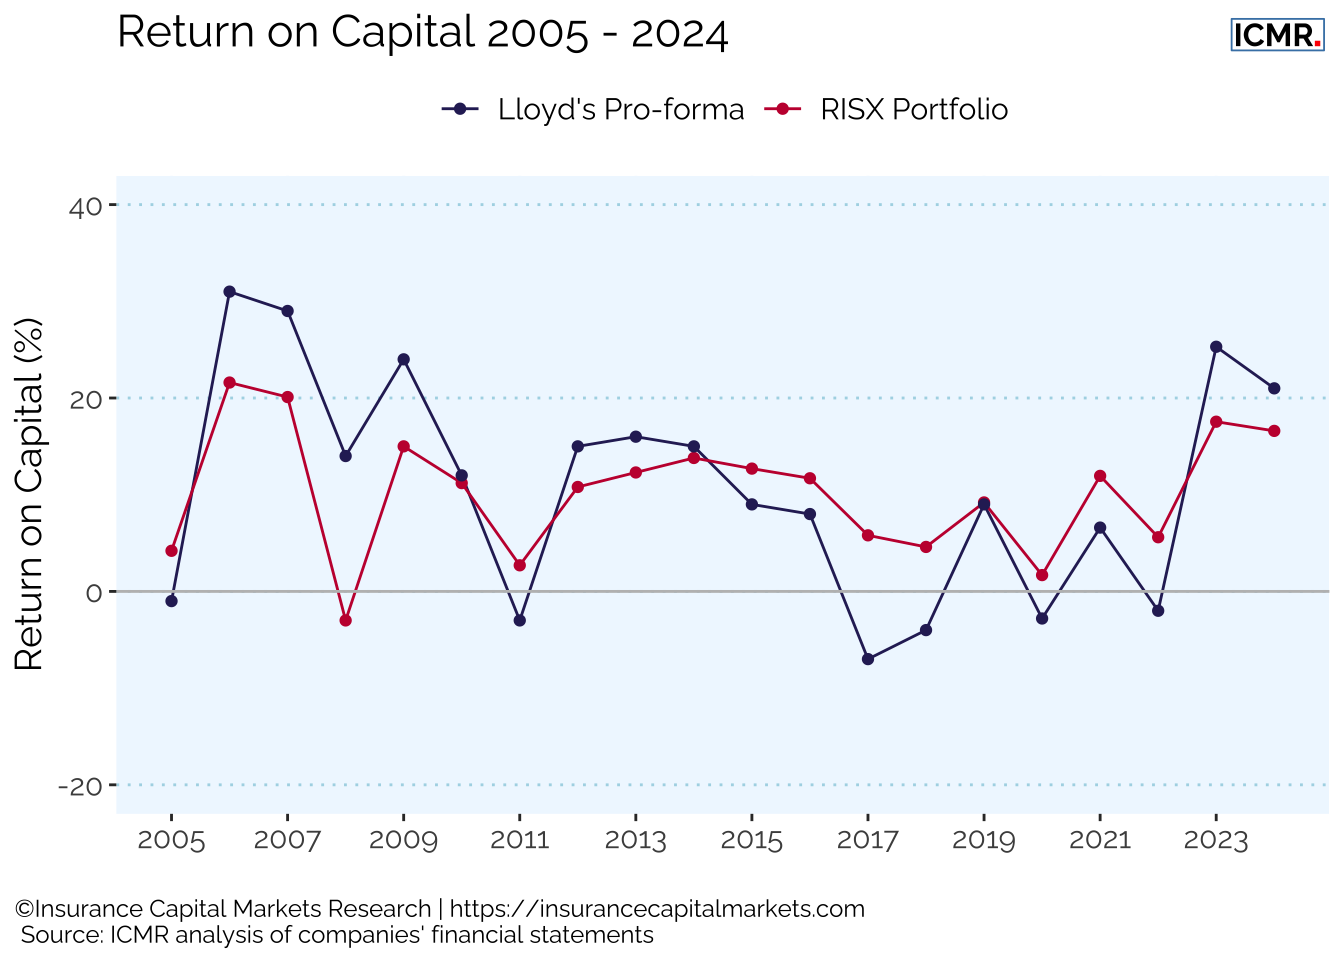

As a result, the long term (20 year) average return for Lloyd’s investors and for the RISX equity index are both virtually identical at a fraction over 10% per annum, or around 7% in excess of the risk free rate, Figure 8.3.
8.2 RISX performance
Given the closeness in the performance of the RISX portfolio to Lloyd’s pro-forma, the aggregate of the share price movement of the underlying RISX constituents provides a proxy for the “share price” movement for Lloyd’s, as if it were a publicly listed company.
Over the last 2 calendar years, as well as 2025 Q1, these returns have been very significant, showing a gain of 15.3% in 2023, a gain of 31.8% in 2024 and 11.9% over the first quarter of 2025.
Unlike Lloyd’s pro-forma return on capital, the RISX performance is a real investment benchmark, since the underlying assets are publicly traded equities. An investor can replicate the RISX index by buying publicly traded shares, whereas it is not possible to replicate Lloyd’s pro-forma returns on capital.
With the performance demonstrated in 2024 and 2025, capital markets are still clearly expecting great things of our industry’s performance. The challenge will be for the Lloyd’s market to live up to those expectations.
The RISX factsheet gives more details of the performance.
8.3 Price to book multiple
Using the RISX constituents weights allows us not only to aggregate share prices and other metrics such as combined ratio and return on equity, but also valuation metrics such as price to book, to proxy the value creation at Lloyd’s.
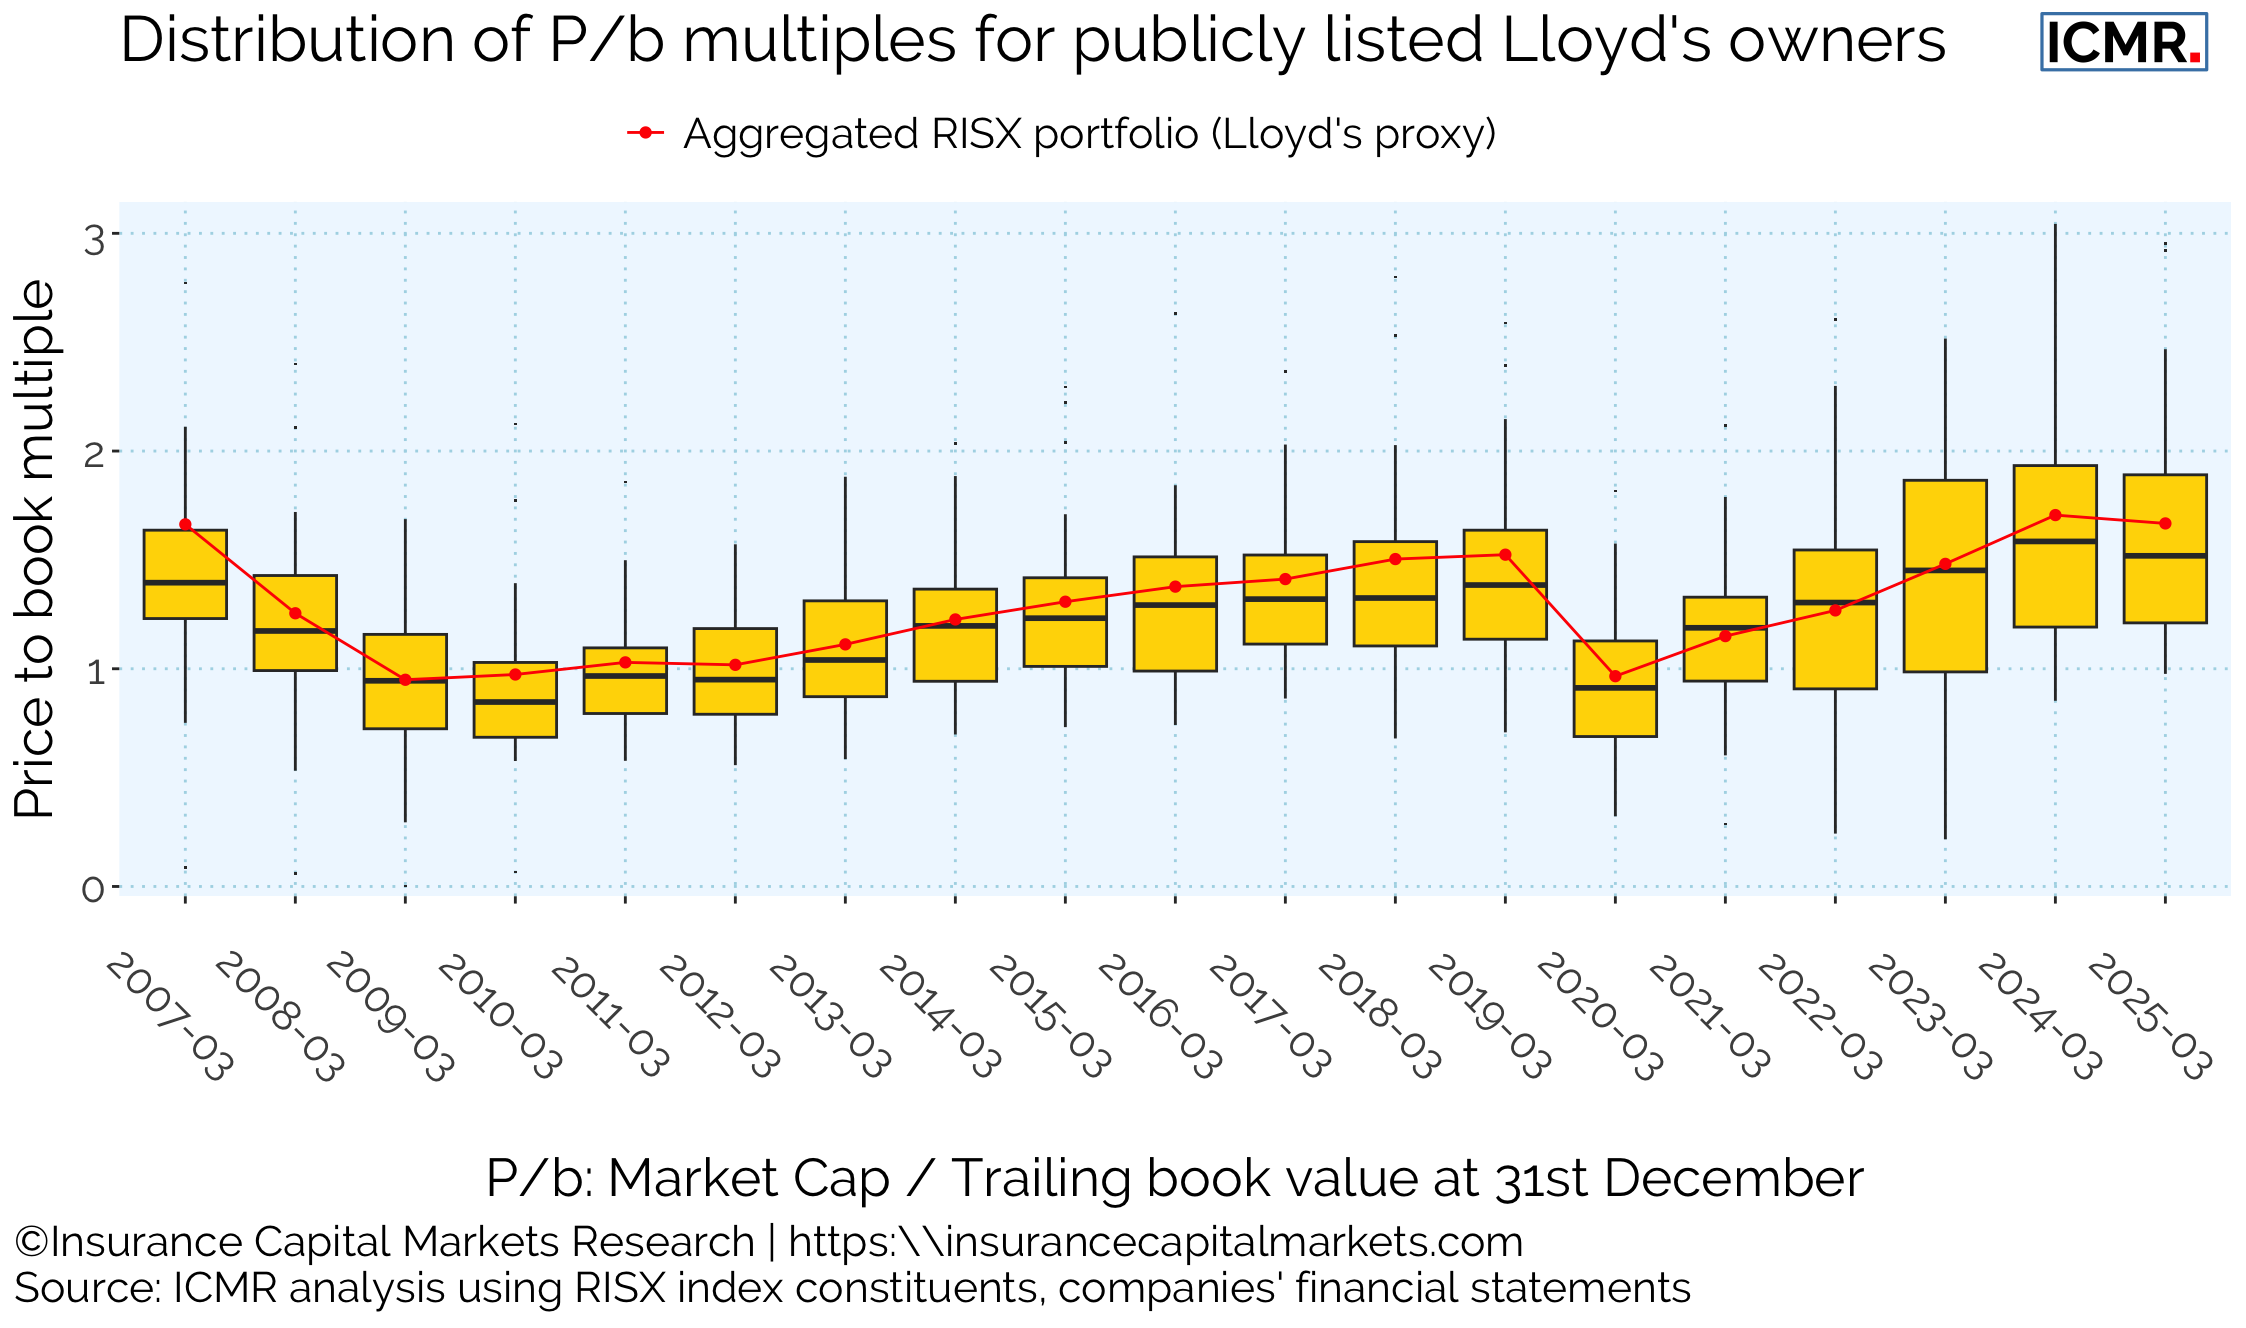
The chart, Figure 8.4, shows a box-whisker plot of the distribution of market capitalisation to trailing book value (P/b) for the between 25 & 40 listed global carriers which have historically owned and controlled syndicates at Lloyd’s. Their cumulative balance sheet shareholders’ equity currently amounts to over USD 1.1Trn (including Berkshire Hathaway) and their global net premium amounts to c.USD 1.2Trn.
As an industry, we are generally sustaining last year’s multiples of book value, with the small reduction in the above chart being driven more by increased retained earnings to fund future growth as of year end 31/12/2024 than by share price reductions.
8.4 Valuation of syndicates
The 2024 & 2025 Q1 performance in RISX has been accelerating, showing capital markets pricing-in the very favourable returns being announced.
Relating this price to book value information to Lloyd’s syndicates reveals the following hypothetical valuations of individual syndicates. (NB - this assumes every syndicate is a discrete integrated Lloyd’s vehicle (ILV) with no capital diversification benefit between syndicates; it is based on ICMR outside-in modelling of every syndicate’s ECA requirement).
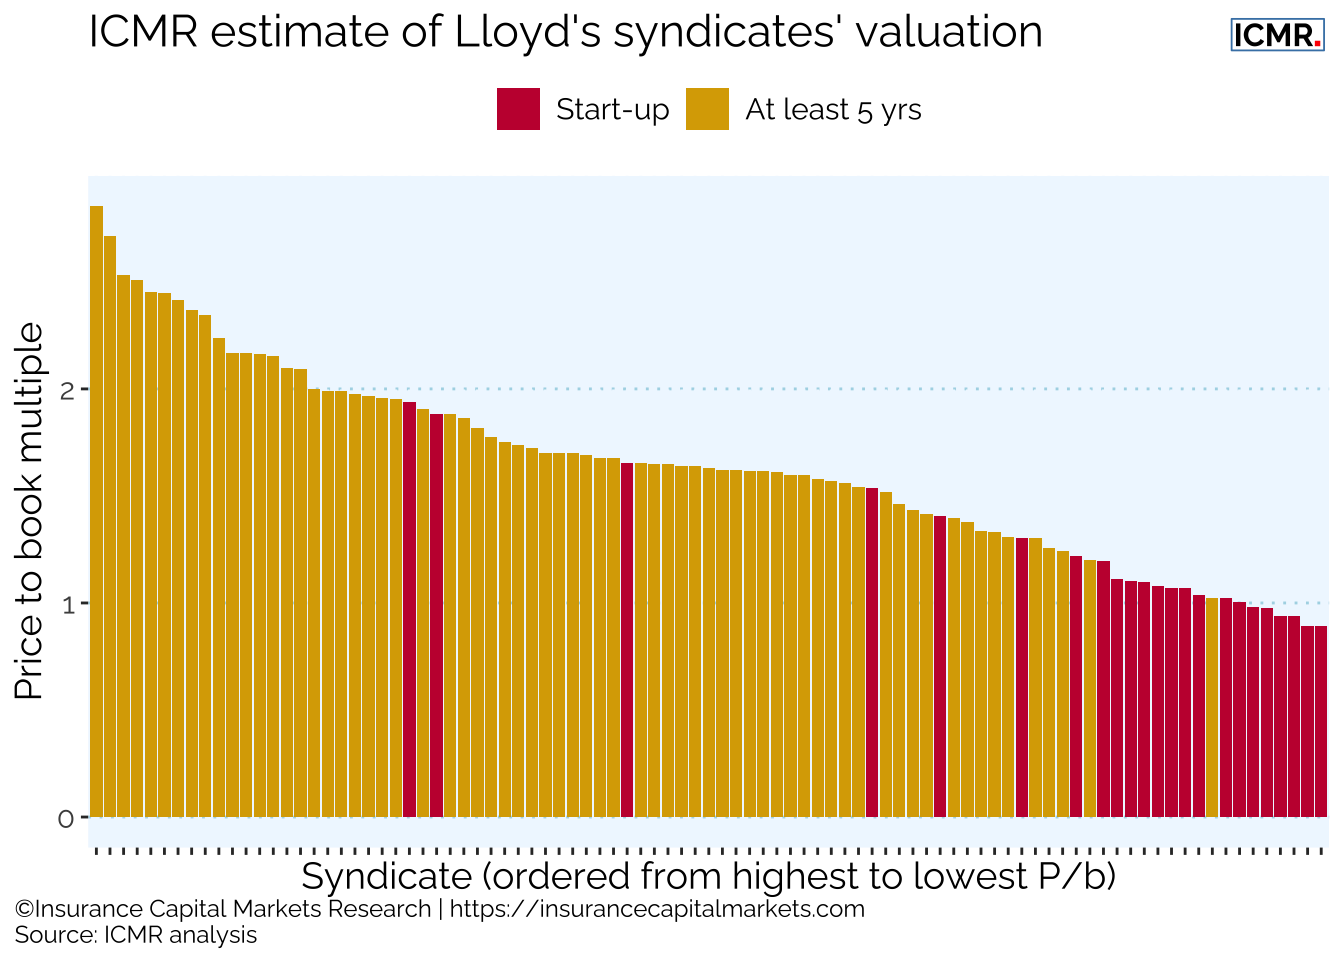
Current public market pricing suggests virtually all syndicates have at least created hypothetical value for their owners, bearing in mind the largest syndicates would not always have the highest P/b multiples. There are still some clear relative under performers, though these are usually start ups in their initial phases, with additional capital loads and costs.
The journey from under performer to out-performer can be illustrated through the following quadrant diagram.
8.5 ICMR.Matrix: The journey to value creator
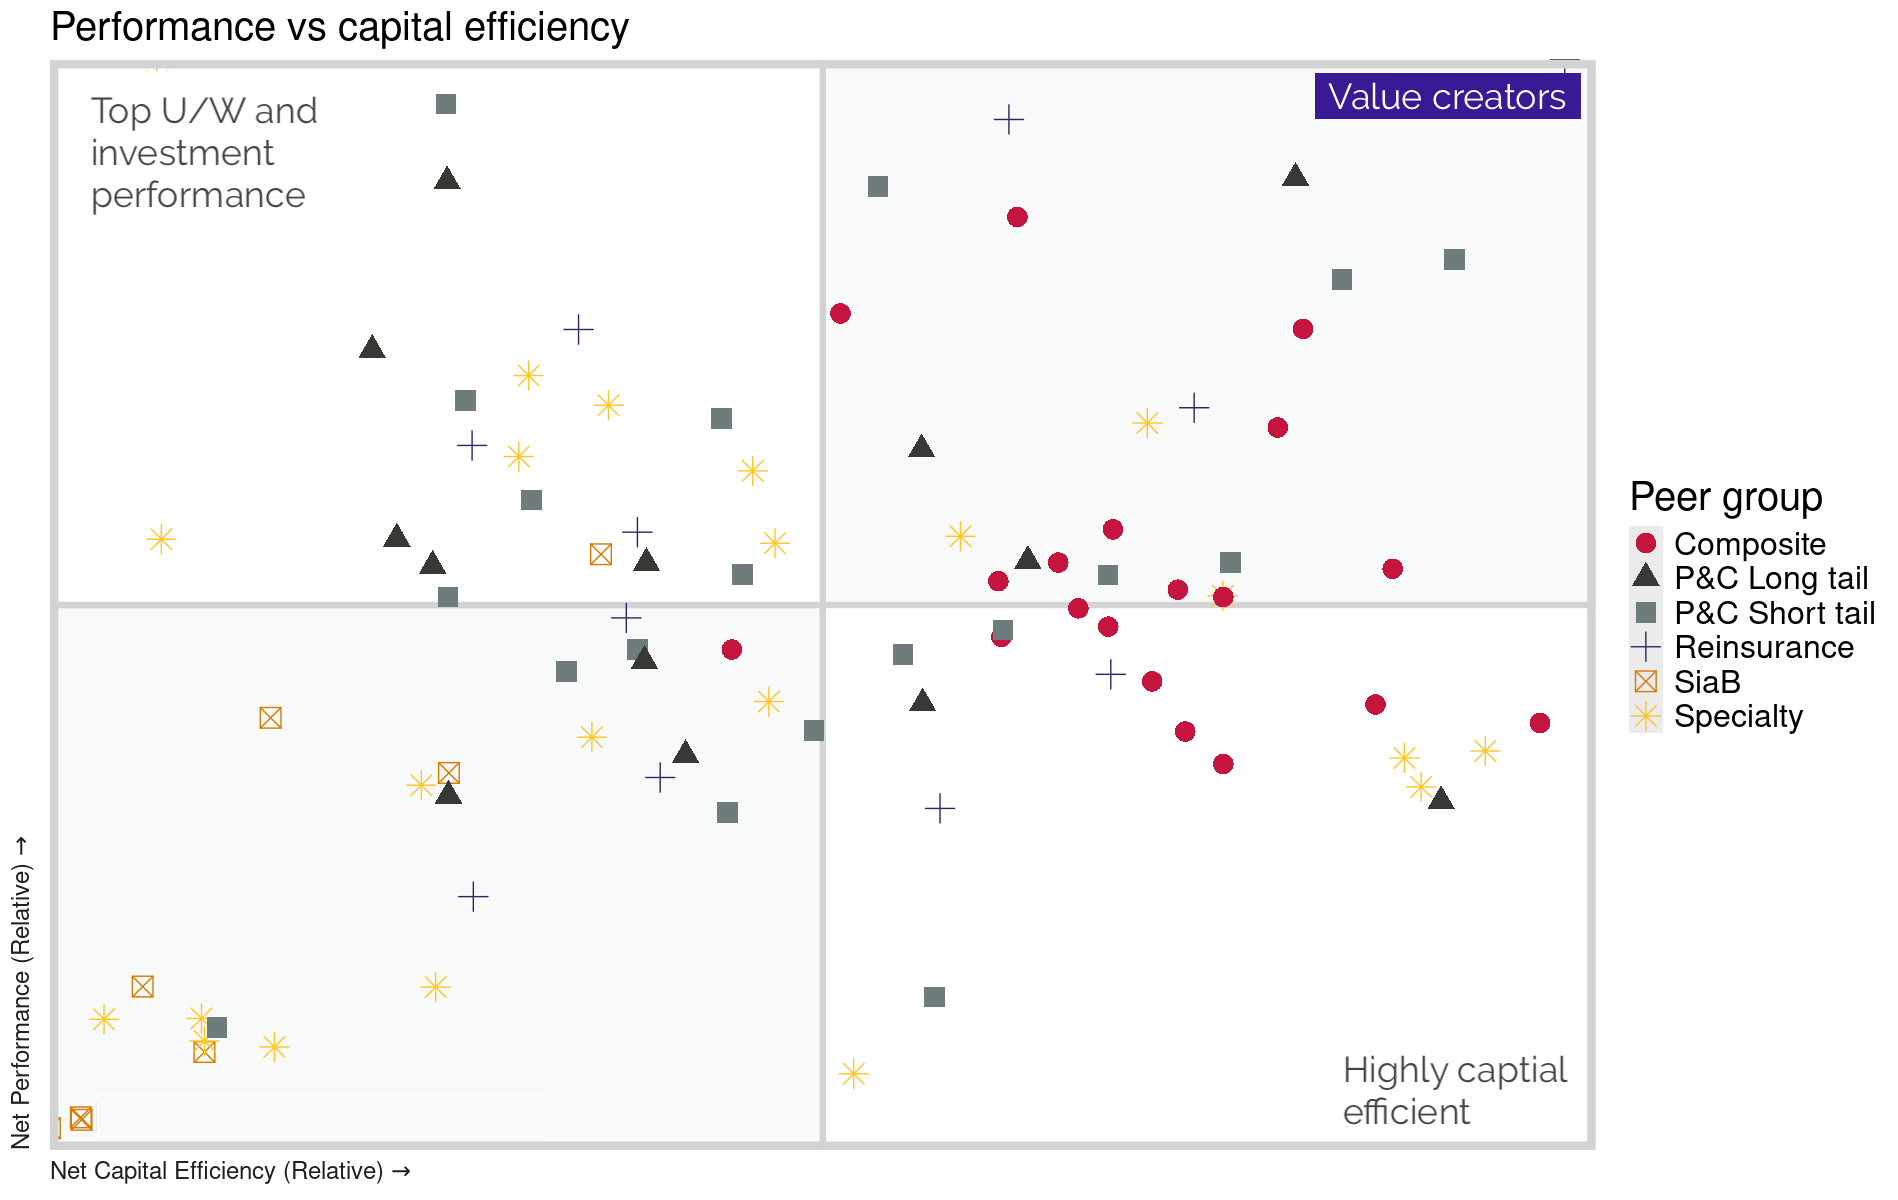
This chart plots each syndicate’s historical relative performance against its relative capitalisation (NB - this is based on ICMR’s outside-in modelling of every syndicate’s ECA requirement, as above).
It shows that the true value creators are those syndicates which both out-perform and also have relatively lower capital requirements (in the top right quadrant of Figure 8.6), usually through diversification. Again, start-ups tend to have worse relative performance as well as capitalisation due to the cost and capital loads applied and begin life in the bottom left quadrant.
The key determinant of success then becomes the strategy for their journey out of the bottom left quadrant to both better performance and/or lower relative capital requirements. This journey can take several years.
Summary
Lloyd’s and the business syndicates at Lloyd’s underwrite are clearly seen as attractive investment propositions, with signs of increasing capital markets’ confidence in our industry and its ability to exceed its WACC for a sustained period of time. This is not to say that capital markets are finding it easy to get into Lloyd’s.
As in 2023, 2024 saw a number of investment initiatives into Lloyd’s that failed to proceed. This might suggest greater reticence on the part of “direct” investors in risk, although the RISX index performance in 2024 and 2025 YTD suggests growing confidence almost to the point of impatience. One reason cited for the lack of success of some of these initiatives is the difficulty in deploying raised funds efficiently. Lloyd’s rules mean capital required for FaL to support a portfolio of syndicates will take 3 years to deploy, under the assumption it is fully allocated on day 1. If it then also takes time to build the relationships and syndicate capacity negotiations, investors’ deployment of funds raised can be glacially slow. This suits neither investors nor asset managers.
If investors have appetite for the favourable returns with lower correlation of the sector as a whole, rather than merely wanting to become Names at Lloyd’s, a more efficient way of deploying funds from day 1 must be found. This may take the form of a bar bell approach, deploying funds raised in a liquid form in the sector initially, then using those funds to ramp up FaL only as and when needed. This would ensure maximum deployment to the sector over the life of the investment, which is usually what investors are seeking.