3 Growth Analysis
Over the last 10 years the Lloyd’s market doubled its premium income from £26,690m to £55,506m

The above Figure 3.1 also shows the premium retention rates year by year. This clearly illustrates the underwriting cycle in that during periods of better underlying pricing conditions, underwriters are more comfortable retaining more risk on their balance sheet and not hedging their volatility out to reinsurers.
3.1 What is driving this growth in premium?
In its annual analysts presentation, Lloyd’s provide details of how much of the change in annual premium income was due to risk adjusted rate change (RARC) and how much was due to movements in exchange rates (F/x).
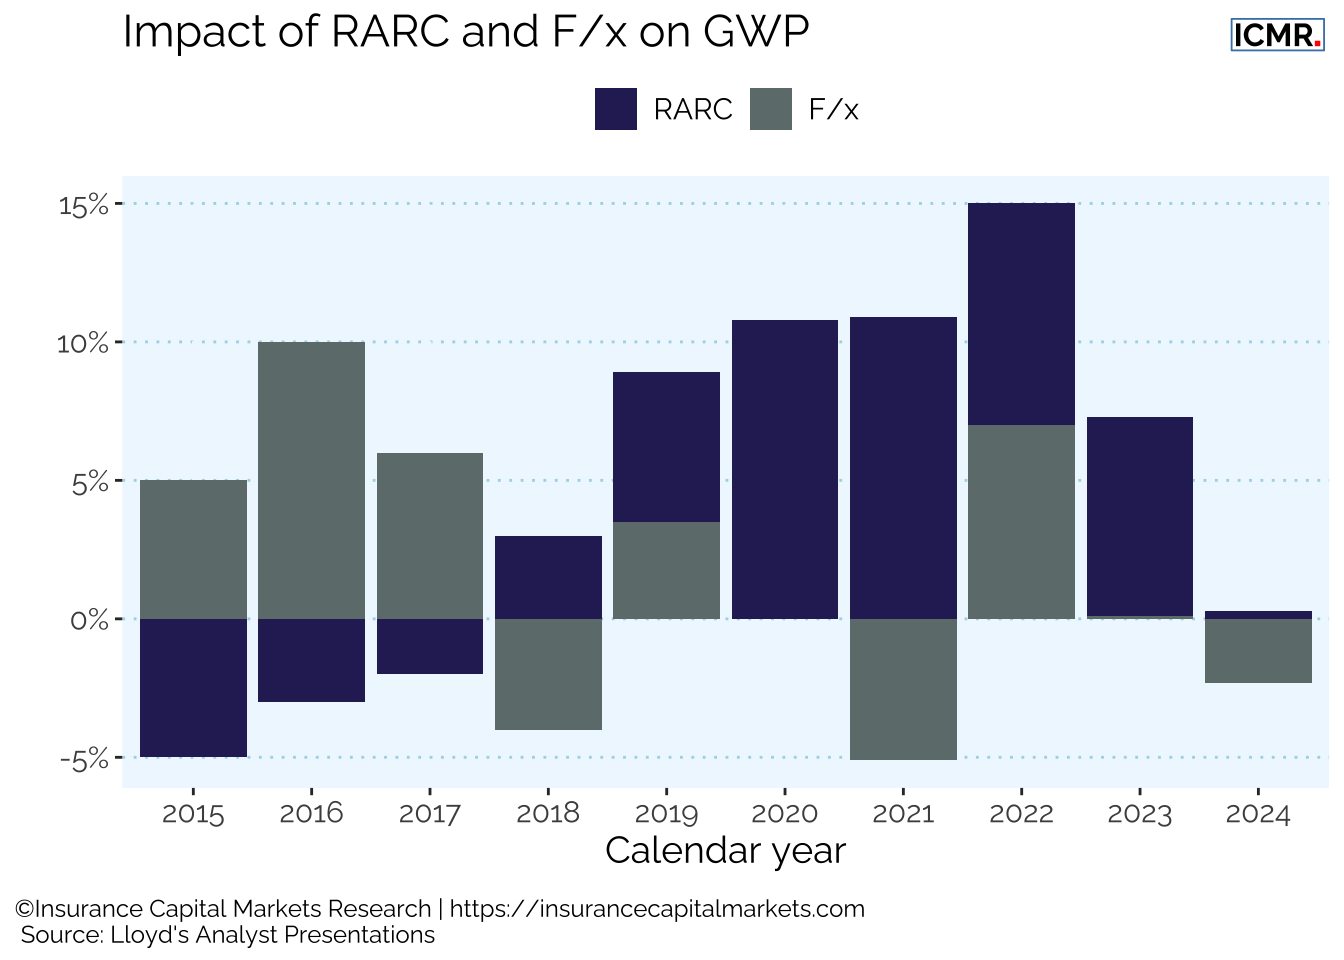
Whilst RARC is an inexact science, we can see from above that a significant portion of Lloyd’s growth has come from improved rate and is not simply underwriters increasing exposure on their balance sheets.
3.1.1 The continuing disciplined recovery
Combining the effects of RARC with F/x reveals a clearer picture of exposure growth in market premium. This shows the effect of the remediation period from 2018 to 2021, indeed through this metric the risk underwritten in 2020 was the same as in 2015. Following this period there was an acceleration of exposure growth from 2022 to 2024, with the market taking advantage of a much improved rating environment. Although RARC is only applicable to renewal business, which makes up c.70% of premium, we believe it is indicative for overall risk adjusted price changes.
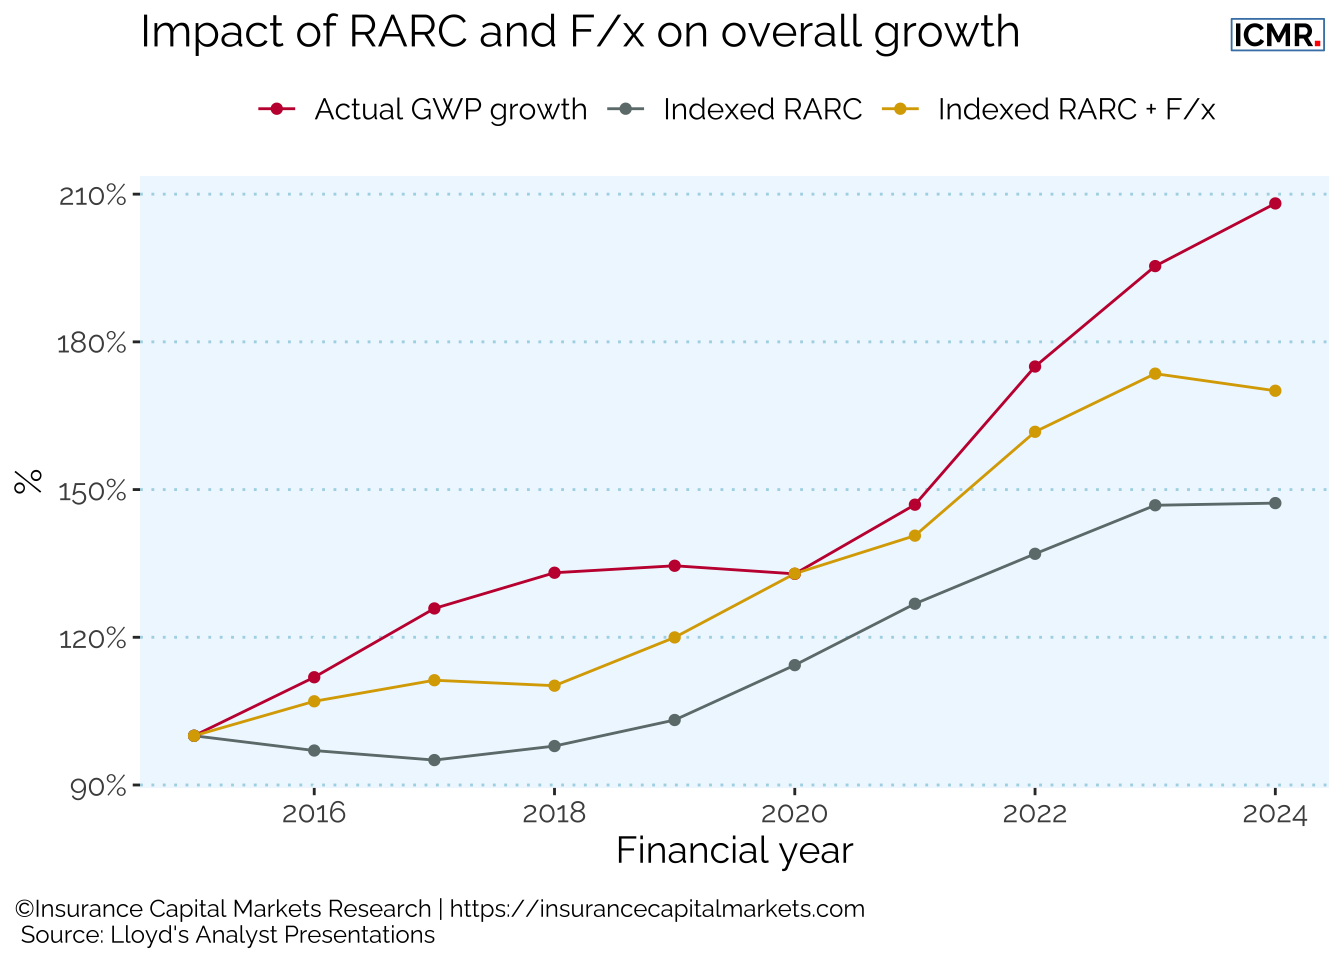
Most of the market’s premium growth since 2015 has arisen from improvements in underlying rate change in combination with exchange rates, suggesting a disciplined approach to premium growth at the correct point in the underwriting cycle. This also implies that the performance management effort in Lloyd’s and market firms continues to deliver on its mission.
3.2 Syndicate growth analysis
The total number of syndicates changes every year with market dynamics. The current syndicates are listed in the Appendix, including the anticipated start-ups for 2025.
This dynamic has been aided by Lloyd’s initiatives, particularly regarding the syndicate in a box (SiaB) initiative, where ideas can be tested in the market before committing to full syndicate costs.
In 2024 four new syndicates started (Apollo NormanMax 3939, Axis Energy Resilience 2050, Apollo Africa Specialty Risk 2454, Asta Fidelis 3123), as did three SiaB (Asta Oka SiaB 1922, Asta MCI 1966, Asta Agile 2427) and two SPA (Apollo EnvelopRisk SPA 1925, Probitas AdA SPA 2024) adding about £500m of capacity to the market place, while Polo RITC 1110 went into run-off.
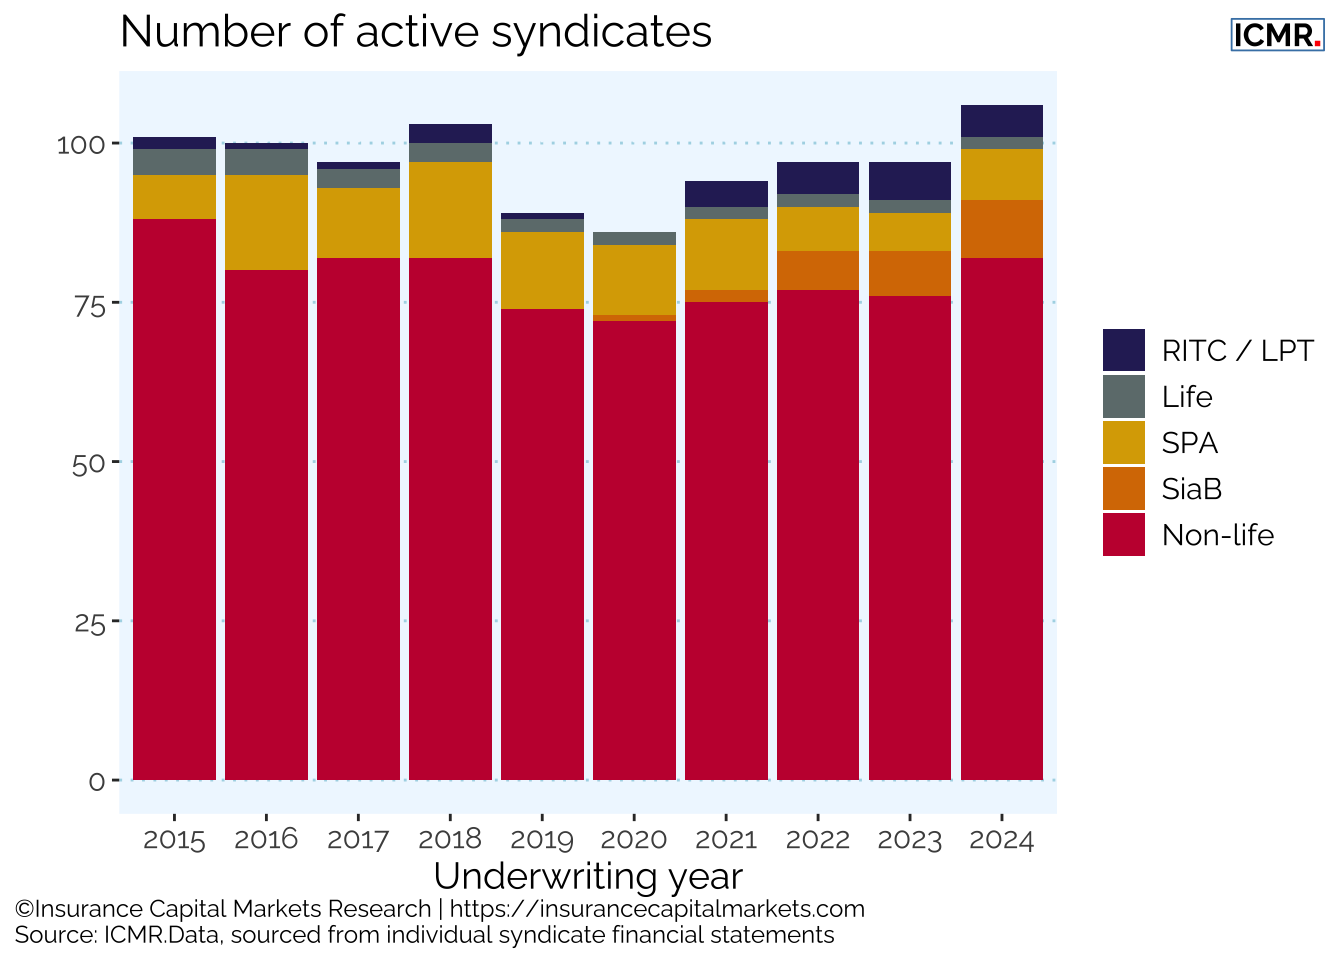
Although the number of syndicates has stayed close to 100 over the past decade, there have been a number of movements in the market. SiaB is now an established route for new ideas to incubate at Lloyd’s, as are special purpose arrangements (SPAs) alongside reinsurance to close (RITC) and legacy writers, who again undertook a number of transactions during 2024, including converting existing loss portfolio transfers (LPT) into RITCs. Some of this reflected remediation activity, but legacy transfer remains an important tool by which syndicates can release capital to support growth in a harder market.
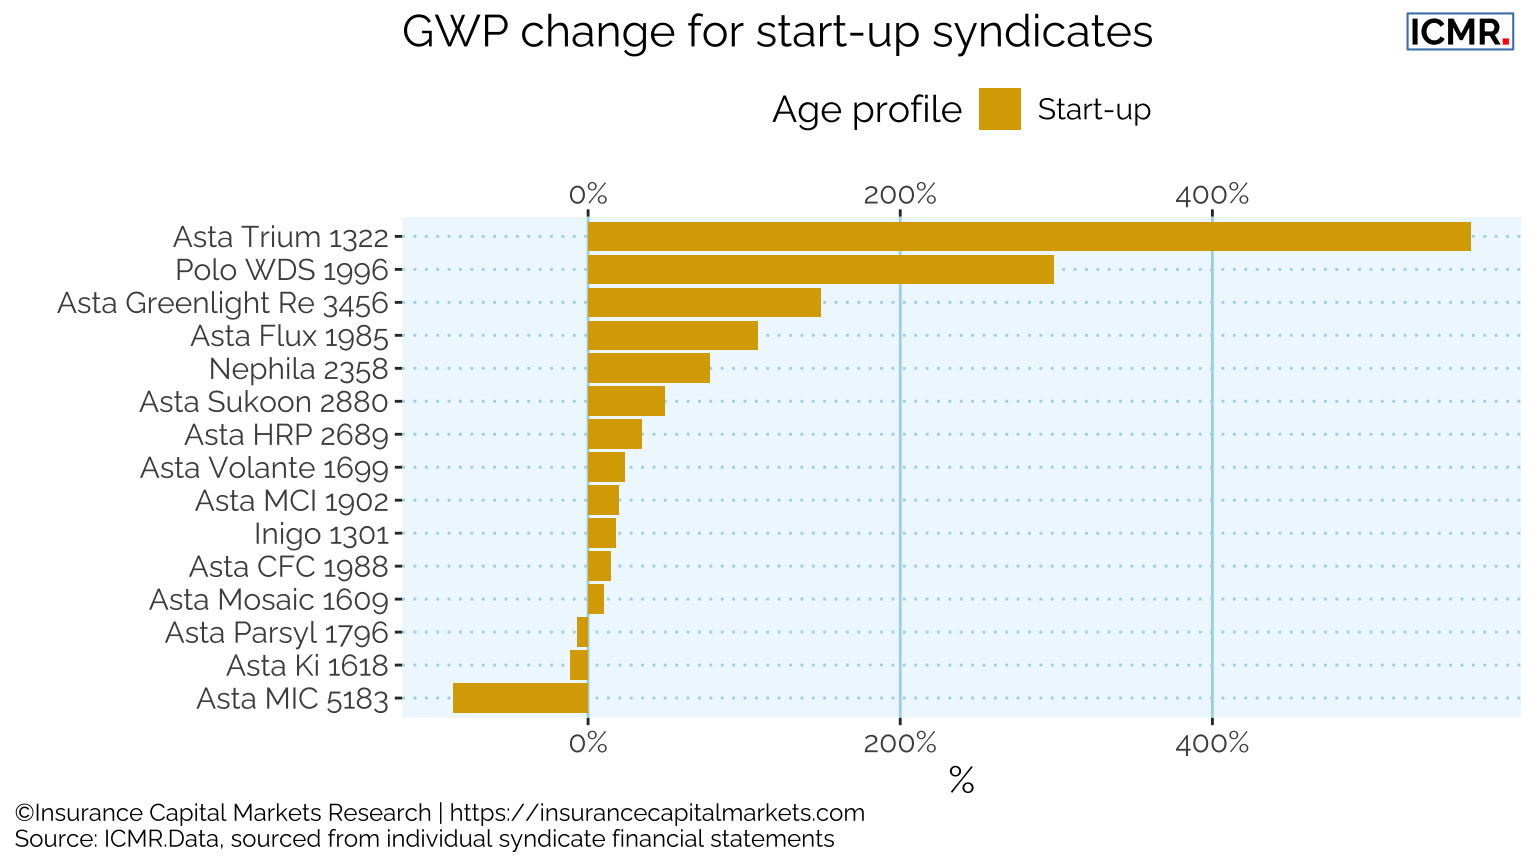
The following tables show the number of syndicates by GWP bandings as well as by age profile, demonstrating the importance of new syndicates, under most operating models, reaching scale within 3-5 years.
Number of non-life syndicates by GWP category over time
Number of non-life syndicates by age profile in 2024
| Syndicate age | Under £200m | £200 - £500m | £500m - £1bn | £1bn - £2.5bn | Over £2.5bn |
|---|---|---|---|---|---|
| Less than 5 years | 10 | 2 | 1 | 1 | NA |
| Less than 10 years | 4 | 6 | 1 | NA | NA |
| Older than 10 years | 5 | 19 | 13 | 18 | 1 |
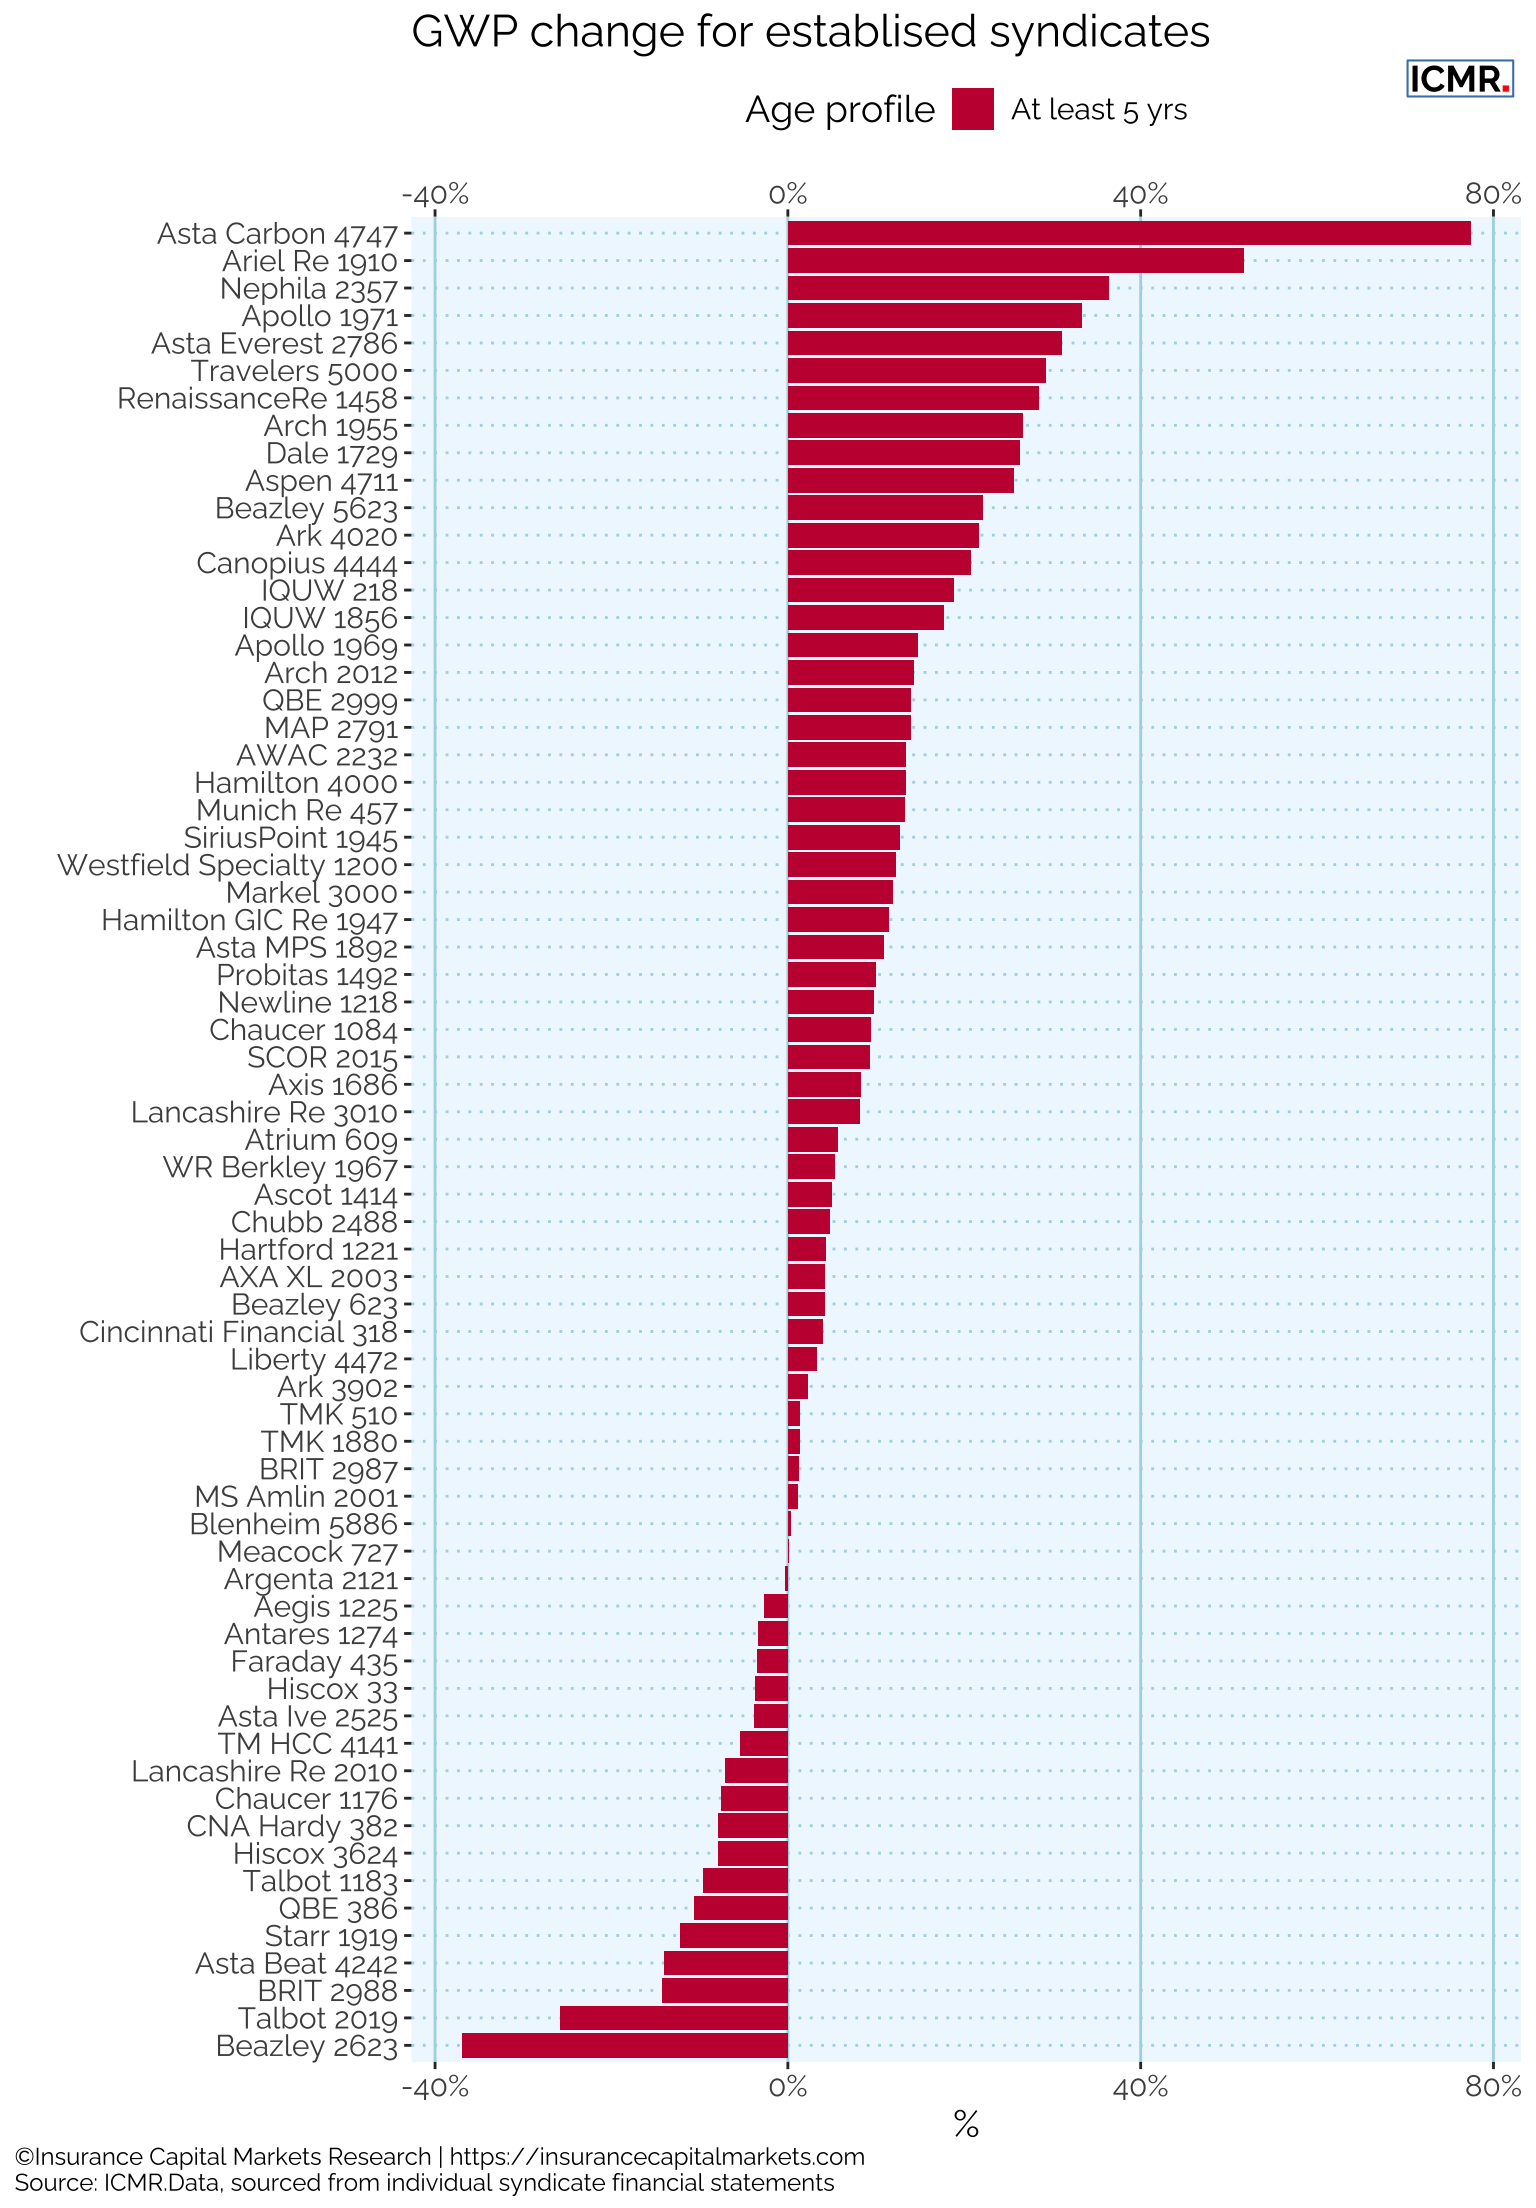
3.3 Premium growth
The following chart gives a more detailed view of syndicates’ GWP evolution over the last two years.
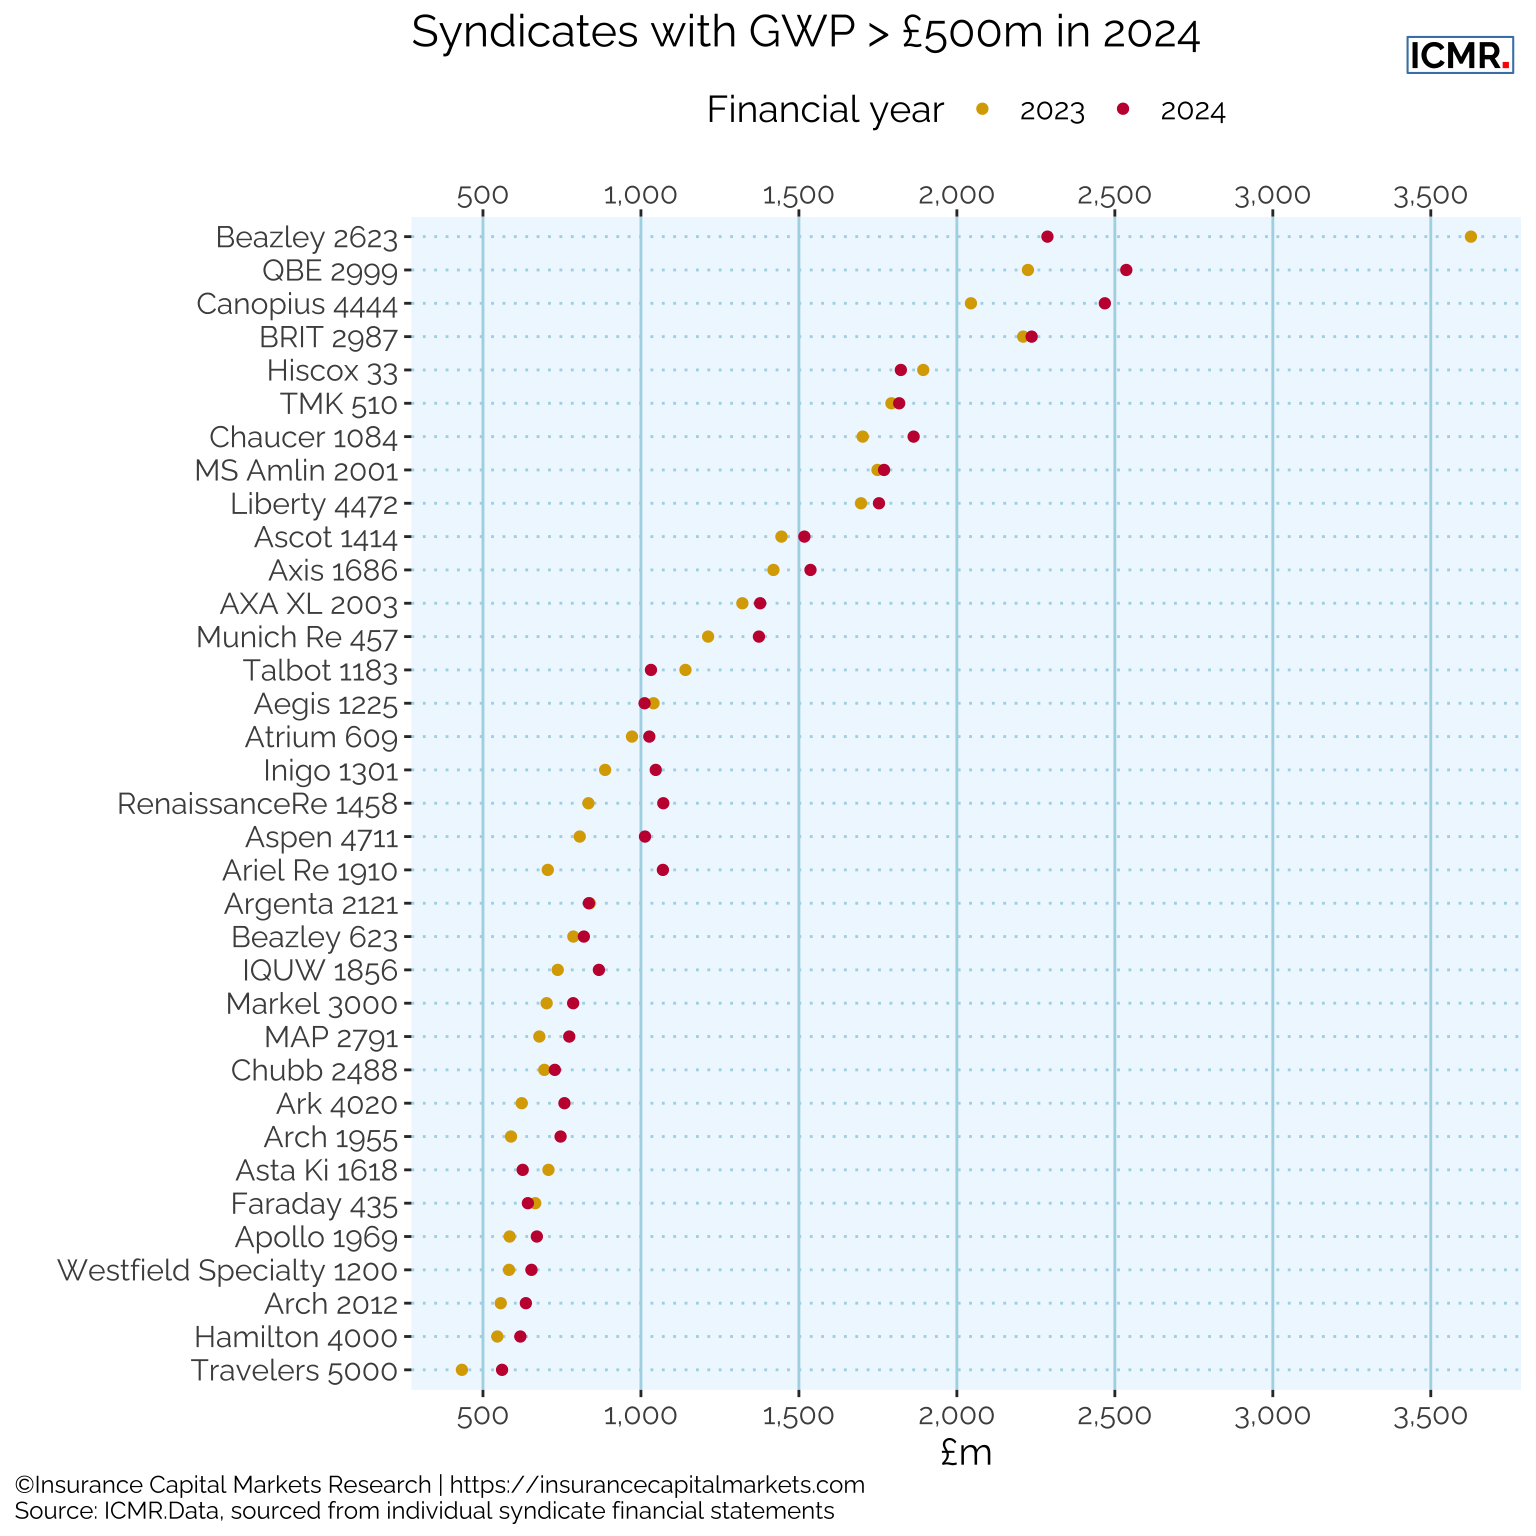
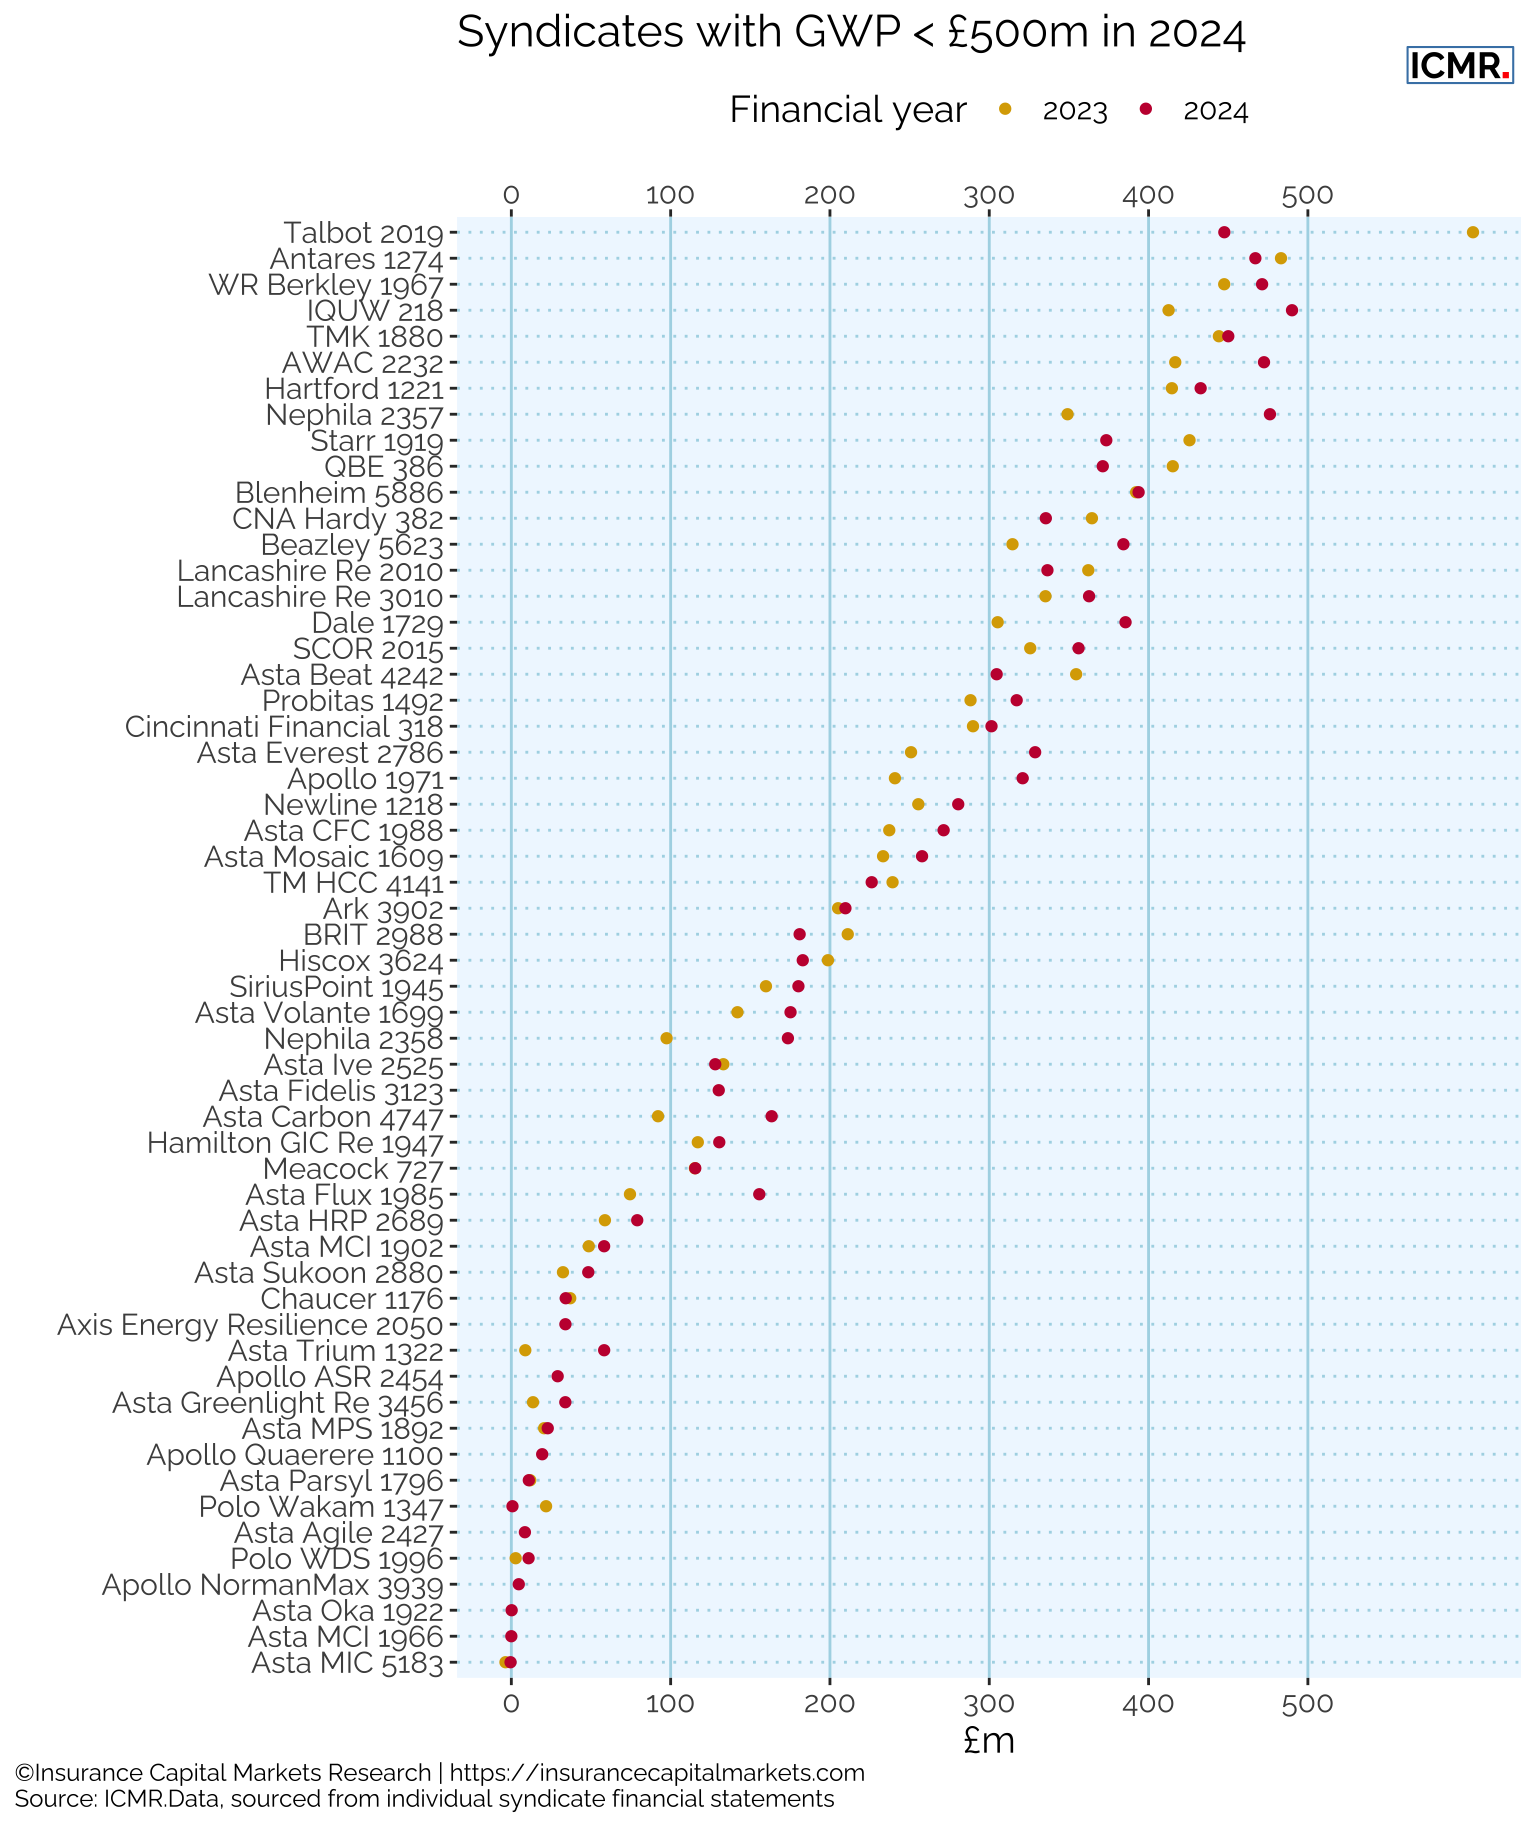
Overall, Lloyd’s gross written premium increased by 9%, but two syndicates show a substantial reduction: Beazley 2623 and Talbot 2019. According to their financial statements, Beazley will no longer underwrite business sourced domestically by Beazley’s US-based underwriters through its syndicate 2623, and Talbot 2019 reduced the quota share of AIG HNW portfolio from 70% to 50%.
The disciplined approach to premium growth, through increasing rate rather than simply increasing exposure, has underpinned Lloyd’s improvement and investors’ underwriting driven returns since 2020.
Ever since the financial crash of 2008 when only certain syndicates suffered significant mark-to-market investment losses, the focus has rightly been on underwriting.
However, with the increasing proportion and quantum investment returns are contributing to Lloyd’s overall result, a key test will be how successfully Lloyd’s can dissuade syndicates from “cashflow underwriting” and the mentality that goes with it.