4 Performance Analysis
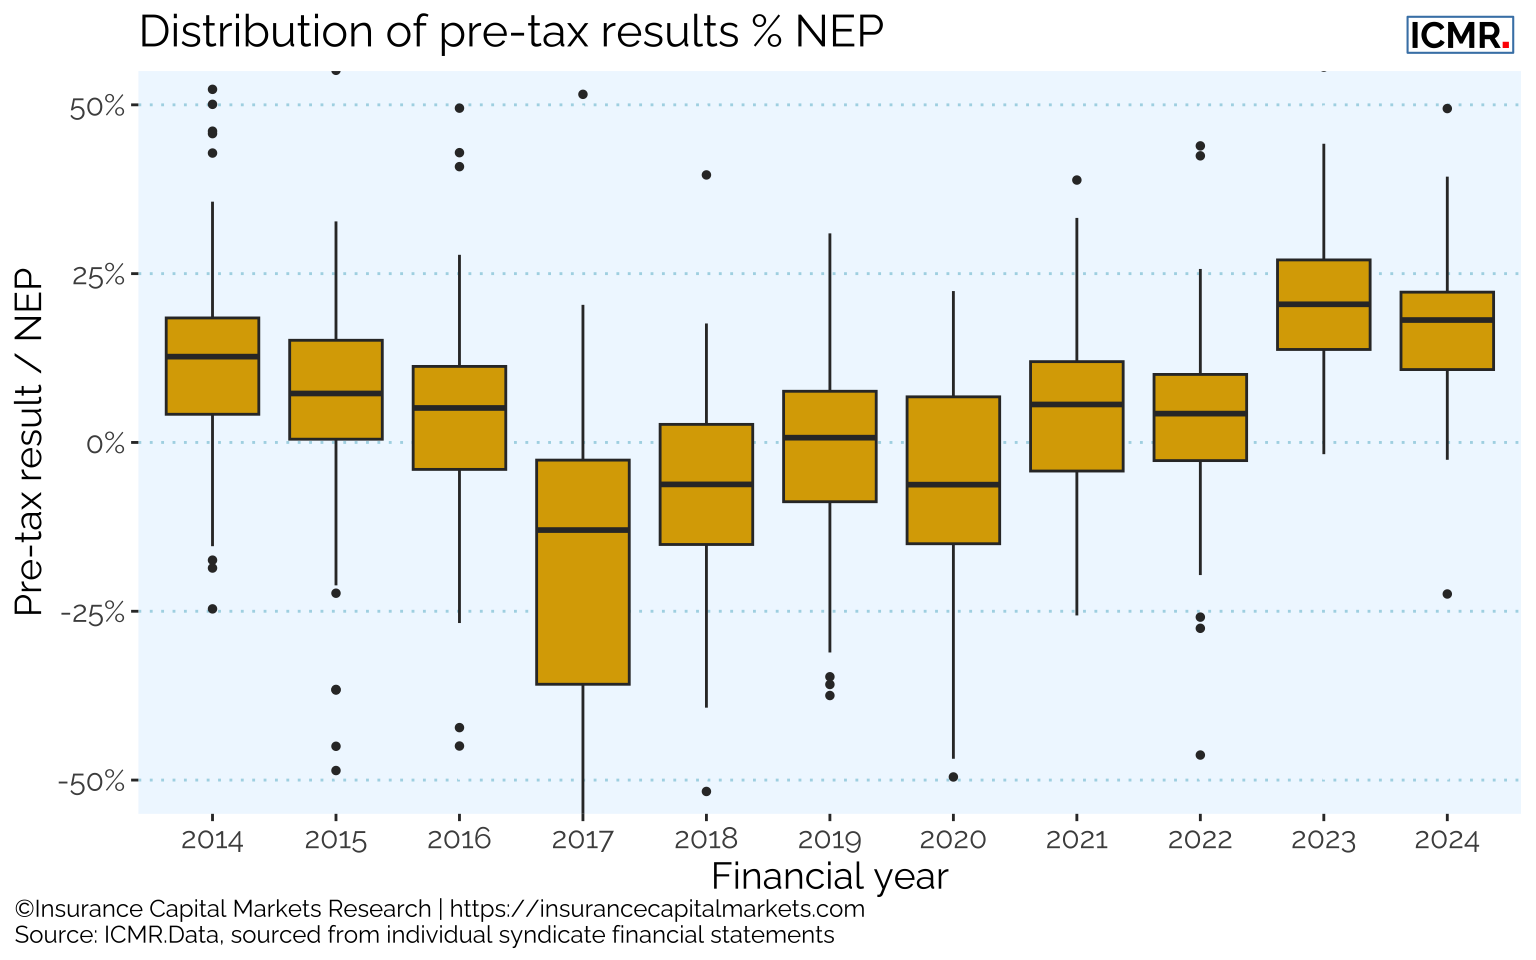
In 2024 Lloyd’s reported an aggregate pre-tax profit of £9,626m (2023: £10,663m) a 23.8% margin on net earned premium (NEP), compared to a 28.9% margin on NEP in 2023. But as always, the aggregate figures hide the distribution of results across the market.
The following box whisker plot shows the range of pre-tax results as a function of NEP over time and across non-life syndicates, i.e. excluding Life, SPAs, SiaB, legacy writers and run-offs. As with 2023, in 2024 nearly all syndicates reported a pre-tax profit.
The top 10 most profitable syndicates pre-tax at each of the last 5 year ends are not necessarily the top 10 syndicates by size, as measured by gross written premium (GWP), as the following tables illustrate:
| Pre-tax result | 2020 | 2021 | 2022 | 2023 | 2024 |
|---|---|---|---|---|---|
| 1 | Liberty 4472 | AXA XL 2003 | Beazley 2623 | Beazley 2623 | Beazley 2623 |
| 2 | QBE 2999 | Beazley 2623 | Hiscox 33 | QBE 2999 | QBE 2999 |
| 3 | Chubb 2488 | Hiscox 33 | Nephila 2357 | Hiscox 33 | Canopius 4444 |
| 4 | Ascot 1414 | Talbot 1183 | Aegis 1225 | Chaucer 1084 | Liberty 4472 |
| 5 | Aegis 1225 | Chaucer 1084 | Ark 4020 | Ariel Re 1910 | Chaucer 1084 |
| 6 | Atrium 609 | Liberty 4472 | Talbot 1183 | MS Amlin 2001 | Hiscox 33 |
| 7 | Faraday 435 | Munich Re 457 | Munich Re 457 | BRIT 2987 | Aegis 1225 |
| 8 | QBE 386 | Aegis 1225 | TMK 510 | Nephila 2357 | Chubb 2488 |
| 9 | IQUW 218 | TMK 510 | Atrium 609 | Canopius 4444 | MS Amlin 2001 |
| 10 | MAP 2791 | Atrium 609 | Asta Beat 4242 | Chubb 2488 | Axis 1686 |
| GWP | 2020 | 2021 | 2022 | 2023 | 2024 |
|---|---|---|---|---|---|
| 1 | Beazley 2623 | Beazley 2623 | Beazley 2623 | Beazley 2623 | QBE 2999 |
| 2 | BRIT 2987 | BRIT 2987 | BRIT 2987 | QBE 2999 | Canopius 4444 |
| 3 | AXA XL 2003 | Hiscox 33 | QBE 2999 | BRIT 2987 | Beazley 2623 |
| 4 | Hiscox 33 | QBE 2999 | Canopius 4444 | Canopius 4444 | BRIT 2987 |
| 5 | TMK 510 | Liberty 4472 | Hiscox 33 | Hiscox 33 | Chaucer 1084 |
| 6 | QBE 2999 | Canopius 4444 | Liberty 4472 | TMK 510 | Hiscox 33 |
| 7 | MS Amlin 2001 | TMK 510 | Chaucer 1084 | MS Amlin 2001 | TMK 510 |
| 8 | Liberty 4472 | AXA XL 2003 | MS Amlin 2001 | Chaucer 1084 | MS Amlin 2001 |
| 9 | Chaucer 1084 | MS Amlin 2001 | TMK 510 | Liberty 4472 | Liberty 4472 |
| 10 | Canopius 4444 | Chaucer 1084 | Ascot 1414 | Ascot 1414 | Axis 1686 |
4.1 Underwriting performance vs Growth
The following charts (Figure 4.2, Figure 4.3) look into more detail into the aggregate combined ratio over a three and 10 year period against the compound growth in gross written premium, contrasting aligned and non-aligned syndicates.
Optimal performance and growth would be top right of the chart, with better underwriting performance combining with demonstrable growth. Top left shows better underwriting but a much more cautious approach to growth; bottom right, growth without improving underwriting; and bottom left inferior underwriting and growth.
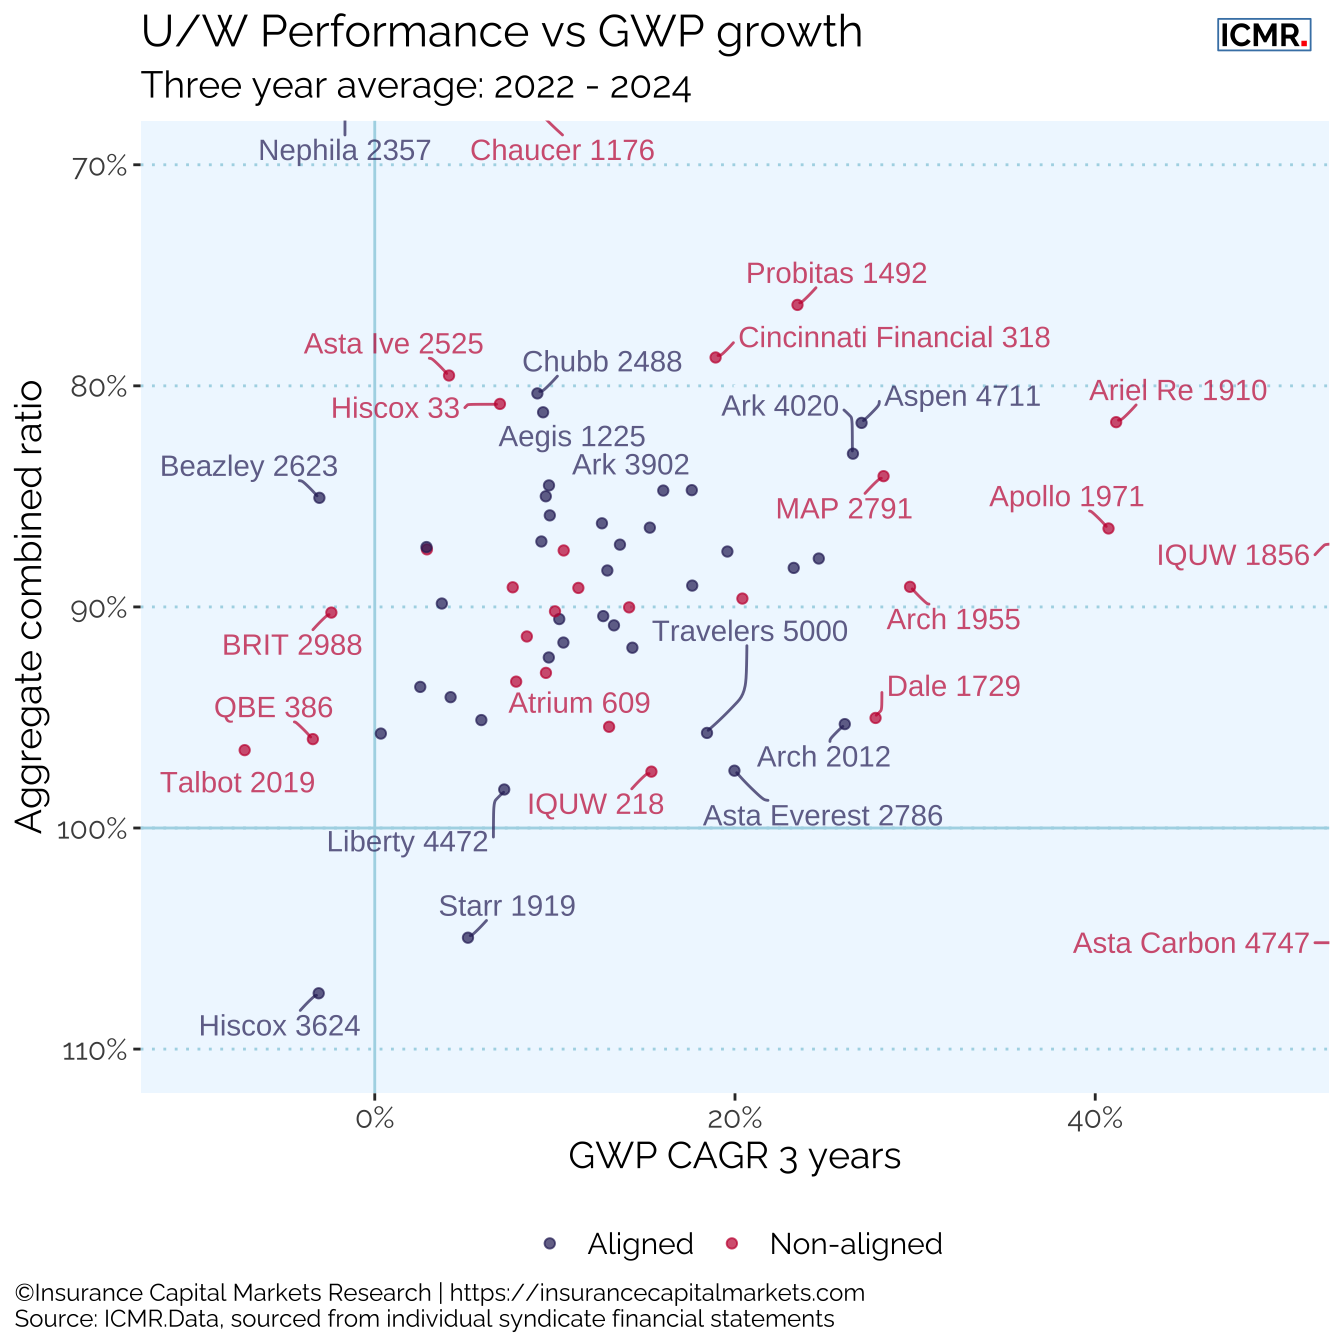
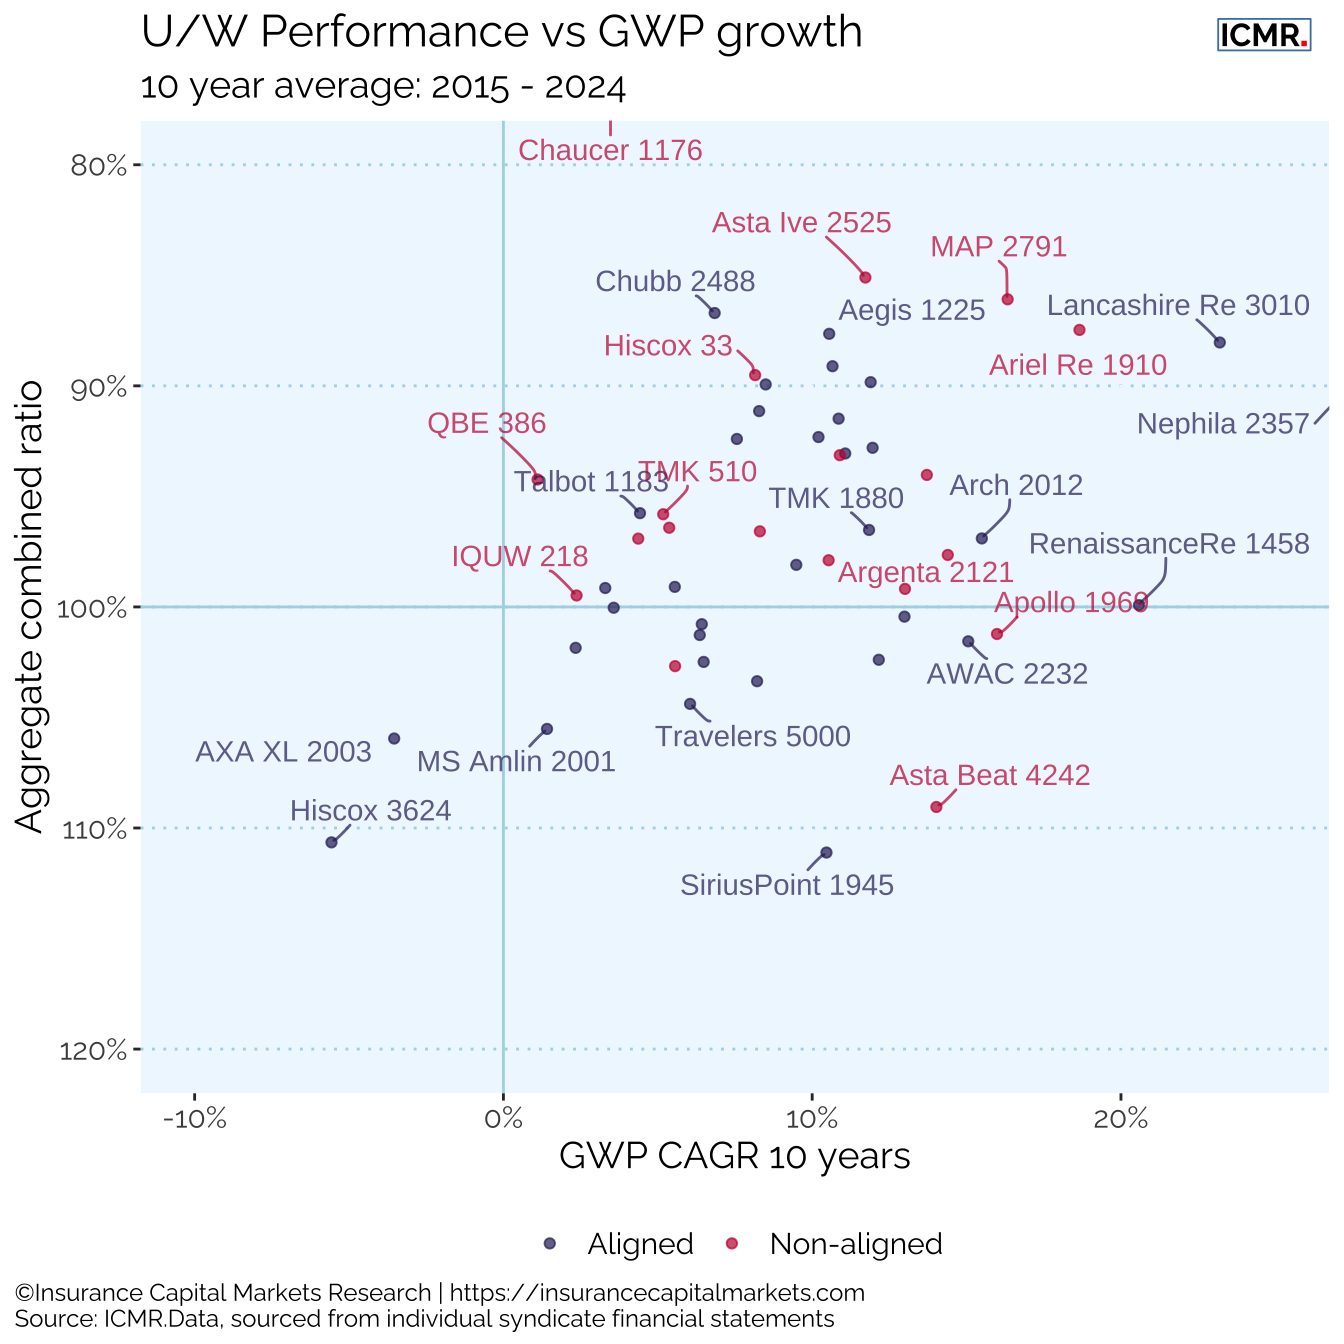
The performance over the last three years reveals how syndicates have taken the opportunity of the hard market. The performance over the last 10 years gives an indication of syndicates’ ability to manage the insurance cycle.
The least favourable quadrant to be in, from an investor’s perspective, is probably the bottom right as this suggests growth without regard to a commensurate improvement in underwriting performance.
The performance over three years suggests that non-aligned syndicates may be able to outpace aligned syndicates on growth in the hard part of the cycle, although this evens out over the whole cycle as seen in the 10 year view.
4.2 Underwriting performance in 2024
The following bar charts show the underwriting performance ratios by syndicate and movements from 2024 year-end.
Given the extra costs and capital loadings usually applied to start up syndicates, the charts show that 2023/24 was clearly a good time to commence underwriting.
4.3 Distribution of underwriting performance
The following charts present the distribution of underwriting performance across syndicates in the Lloyd’s market.
The chart illustrates the impact of the insurance cycle; in the soft part of the cycle only the best performing syndicates delivered an underwriting profit, whereas in the harder part of the cycle the vast majority of syndicates have combined ratios under 100%.
Years which suffered major claims events can also be identified from how spread out the distribution is, as these events rarely fall uniformly across syndicates.
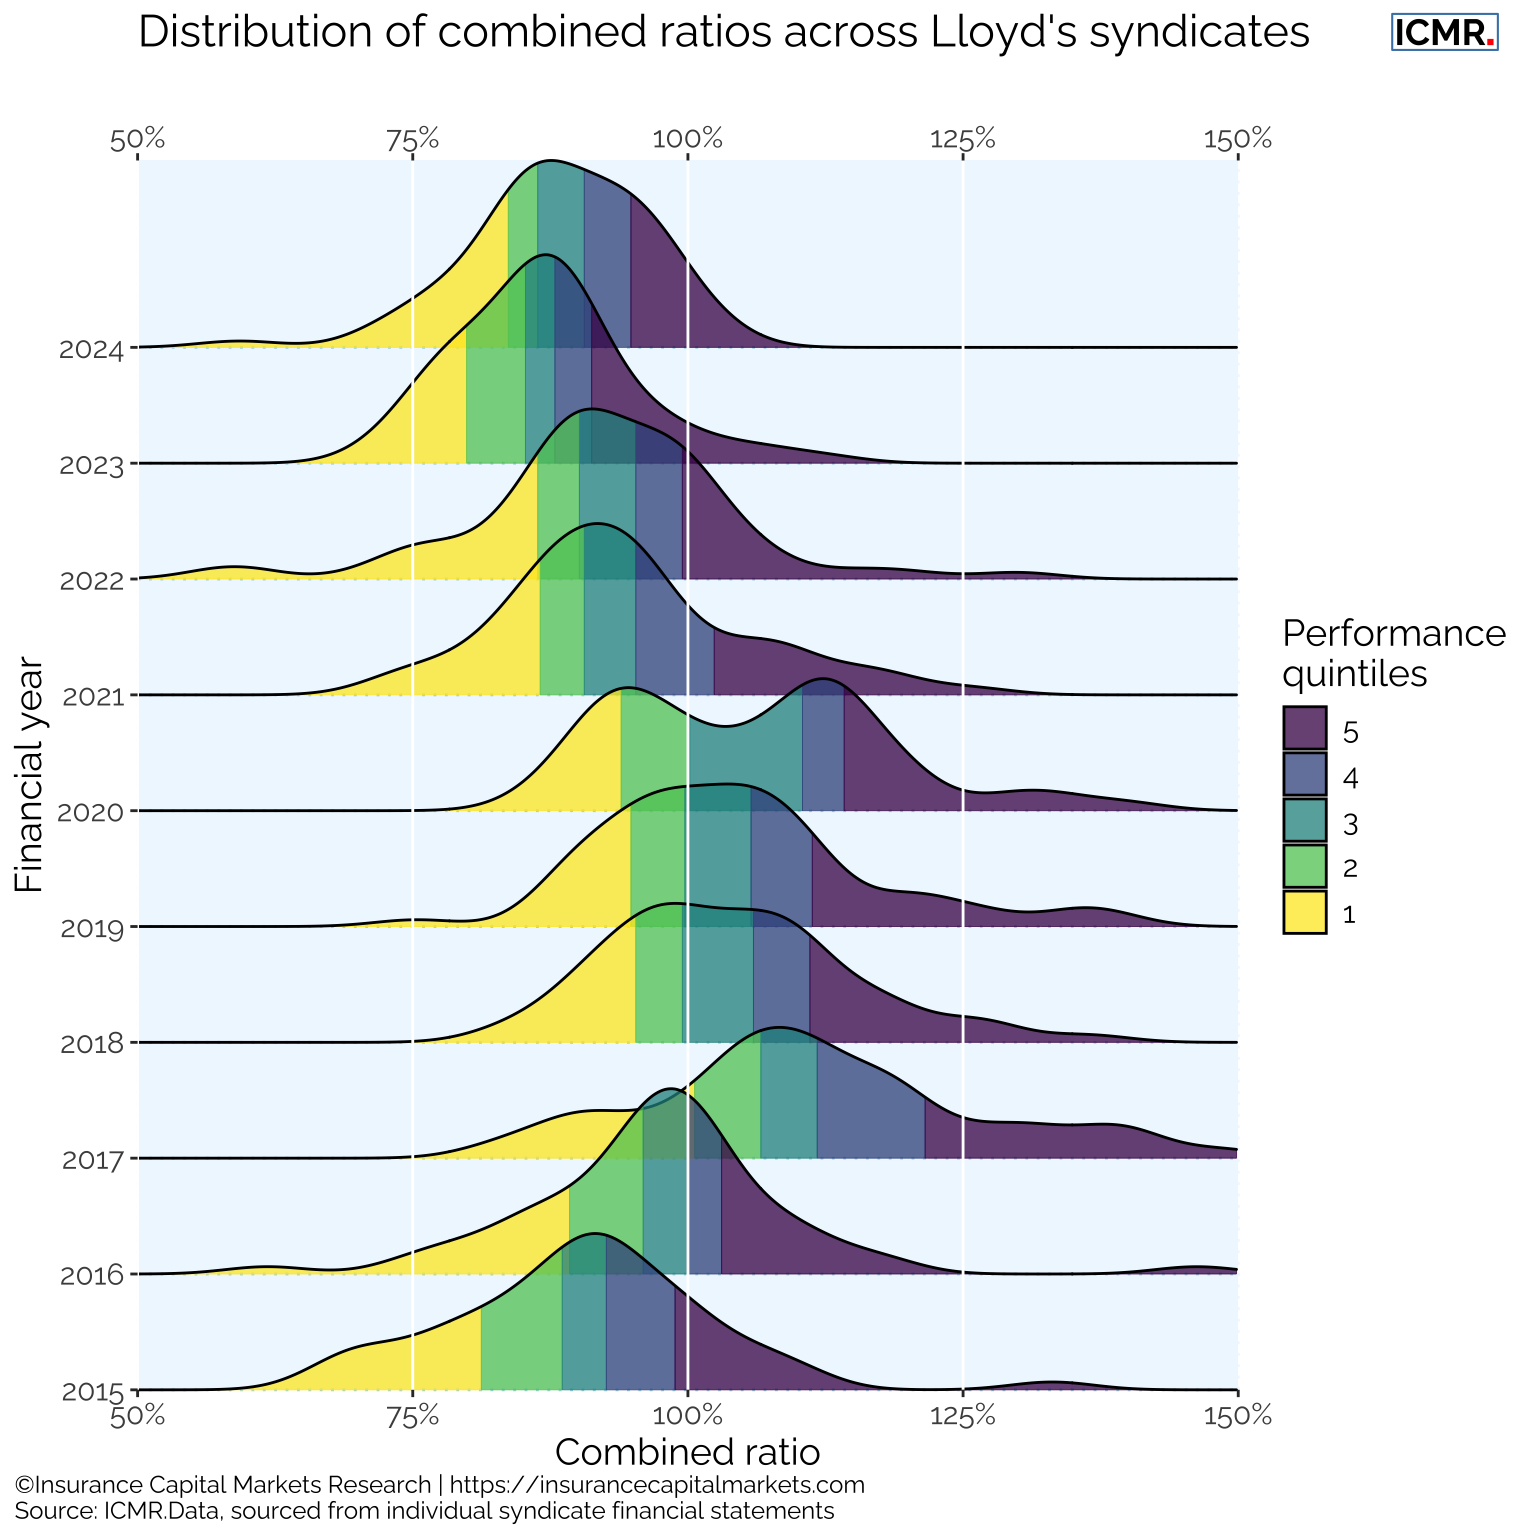
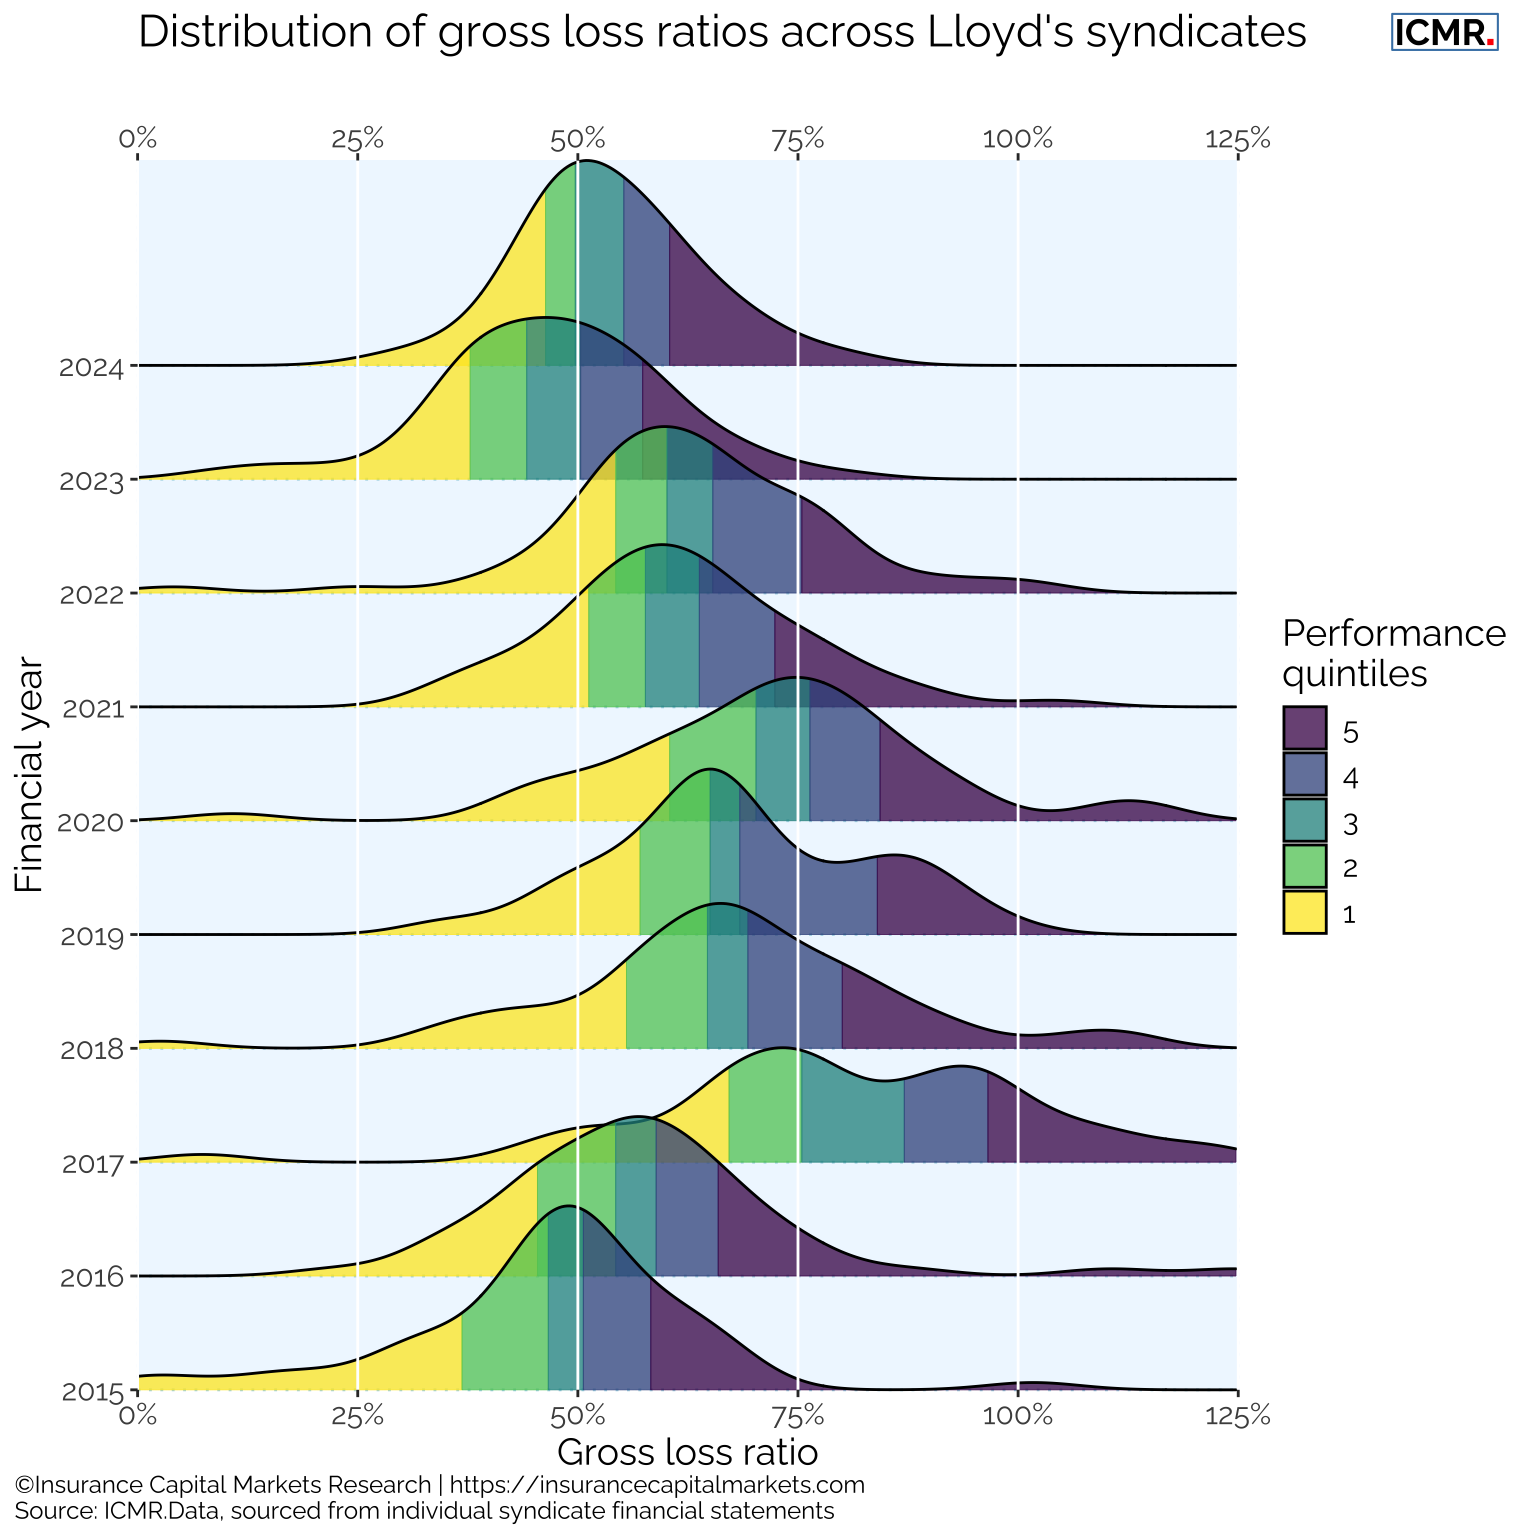
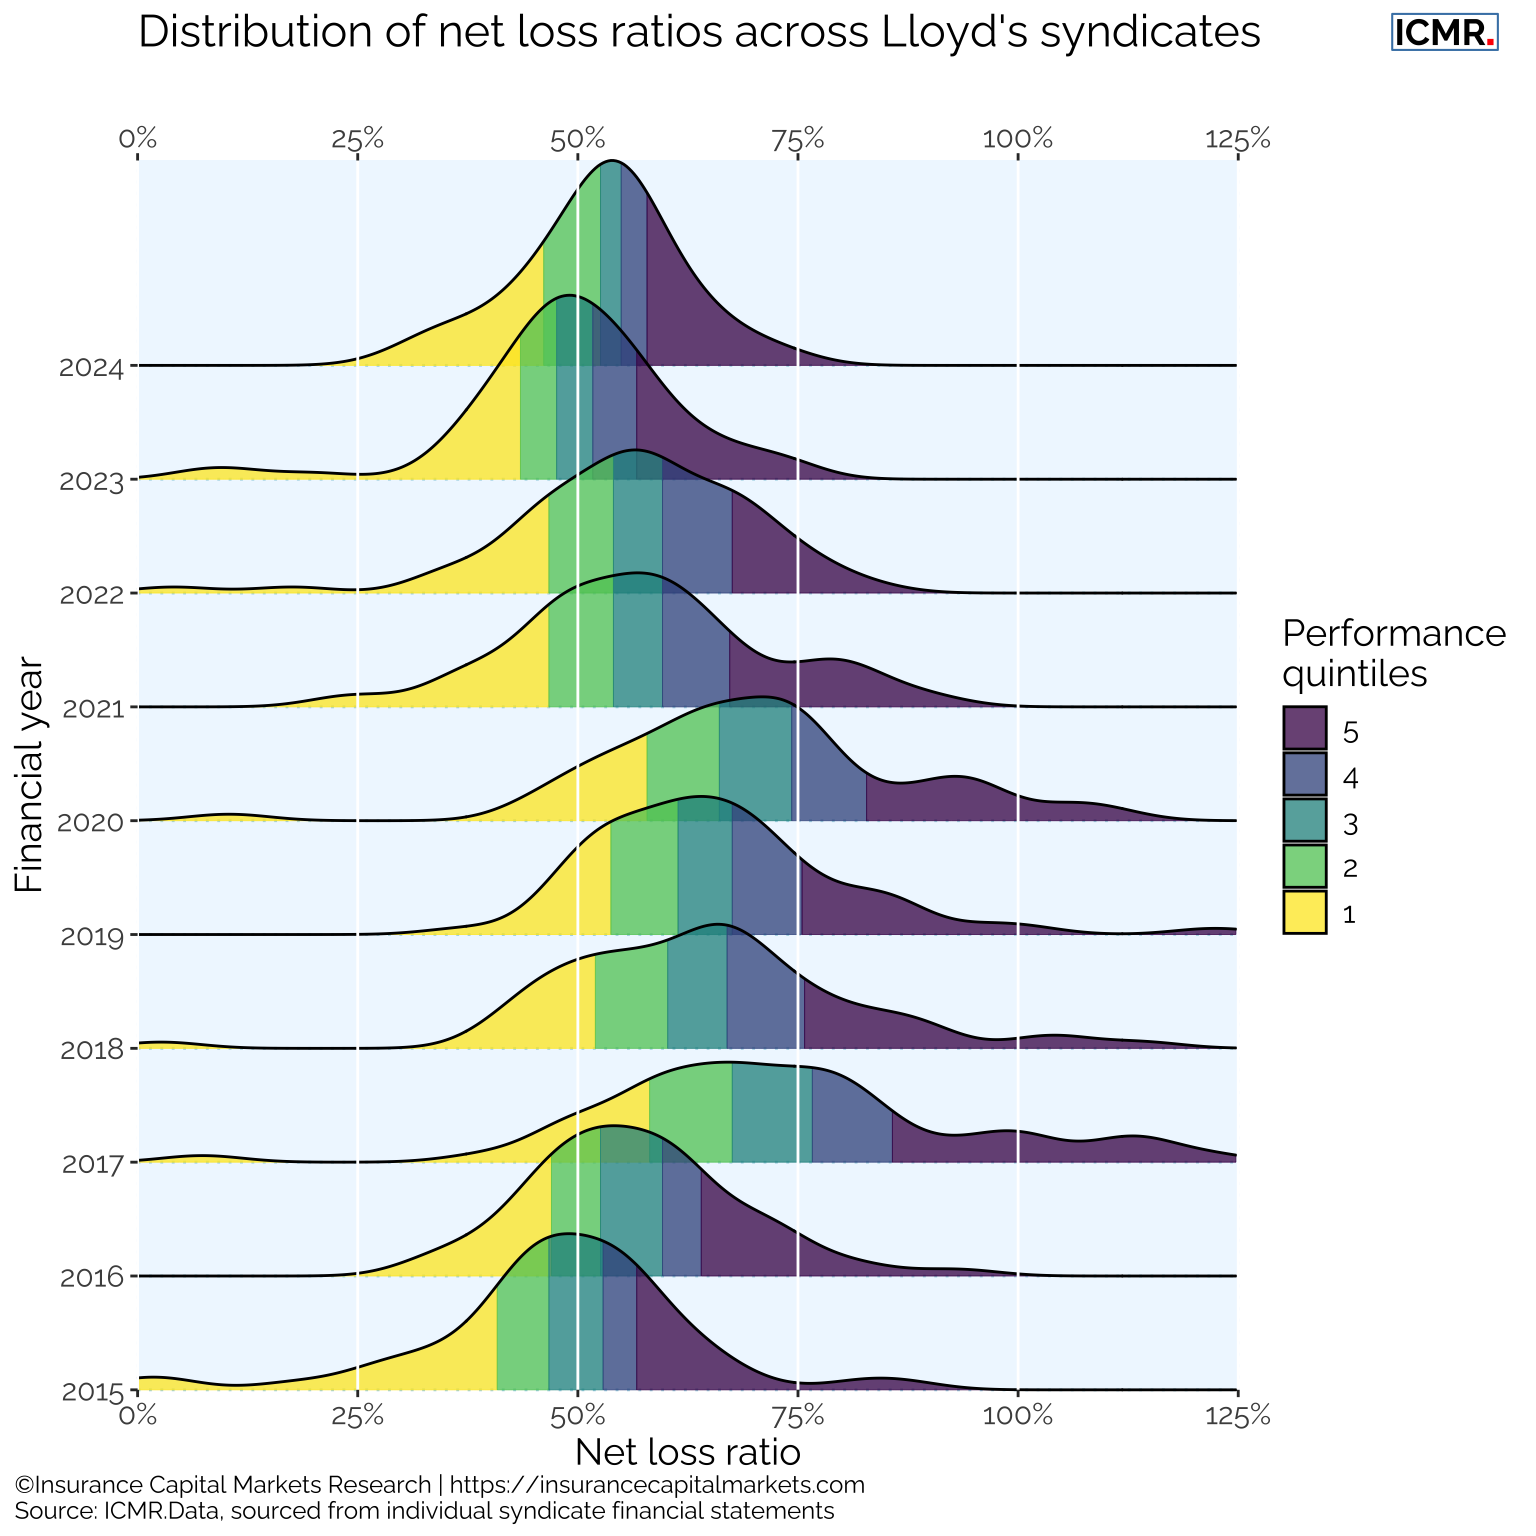
The “double hump” in the combined ratio distribution of 2020 was caused by a combination of concentration of Covid losses along with increased reinsurance costs, including reinstatements, for certain syndicates.
2024 sees a slight shift to the right of the curve as more syndicates have experienced significant losses due to natural catastrophes relative to 2023. This has also resulted in a narrowing of the curve as fewer syndicates have seen the exceptional results of 2023, typified by those heavily property catastrophe exposed portfolios in what was a very benign year for windstorm losses.
4.4 Consistency of relative performance
Similar to sports league tables, the underwriting performance of one syndicate relative to others tends to be stable over time. This is logical given the size and stability of renewal books for many syndicates.
The table below shows the frequencies of syndicates migrating from one combined ratio quintile position to another quintile in the following year over the period from 2015 to 2024.
| From/To | 1st | 2nd | 3rd | 4th | 5th |
|---|---|---|---|---|---|
| 1st | 49.6% | 20.9% | 13.9% | 8.7% | 7.0% |
| 2nd | 22.3% | 28.6% | 24.1% | 13.4% | 11.6% |
| 3rd | 11.4% | 19.3% | 29.8% | 23.7% | 15.8% |
| 4th | 8.9% | 13.4% | 25.0% | 26.8% | 25.9% |
| 5th | 6.1% | 14.8% | 9.6% | 27.0% | 42.6% |
From the diagonal we can see the probability that the performance quintile of a given syndicate will remain the same the following year. For a 5th quintile performer, the chances are 42.6% that it remains a bottom performer, while a 1st quintile performer has a 49.6% likelihood of remaining top quintile the following year. Equally for a 3rd quintile performer, only 19.3% improve to the 2nd quintile in the following year, while 23.7% drop to the 4th quintile.
This consistency of relative performance, whether in a major loss year or a relatively benign loss year, is a distinctive feature of underwriting performance and not just of syndicates within Lloyd’s. It can also be observed, albeit with elevated volatility, within classes of business which can help in parameterising risk models, and predict prospective relative performance (ICMR have developed models to predict future relative performance at both a whole account and a class of business level for syndicates).
This consistency of relative performance over time is the key to developing optimised portfolios, whether a portfolio of risk for a syndicate, or a portfolio of syndicates for an investor. Underwriting outcomes between syndicates are not entirely random events as the fortuity of claims does not impact all (re)assureds or all syndicates equally. Understanding and being able to model this relative performance is key to incrementally improving portfolios over time.