5 Segmental Analysis
The segmental analysis is based on the information disclosed in the notes to the accounts in each syndicate’s financial statements, as well as Lloyd’s pro-forma and aggregate accounts. The data has been curated by ICMR and is available as part of the ICMR.Data offering.
Although this section will focus on the aggregated data for four lines (Reinsurance, Casualty, Property and Specialty) the underlying data is more granular.
5.1 Aggregate gross written premium by COB
Aggregating the data to only four classes shows that the traditional specialty lines have become less material for Lloyd’s over time, while new classes such as Cyber have grown significantly as part of Casualty.
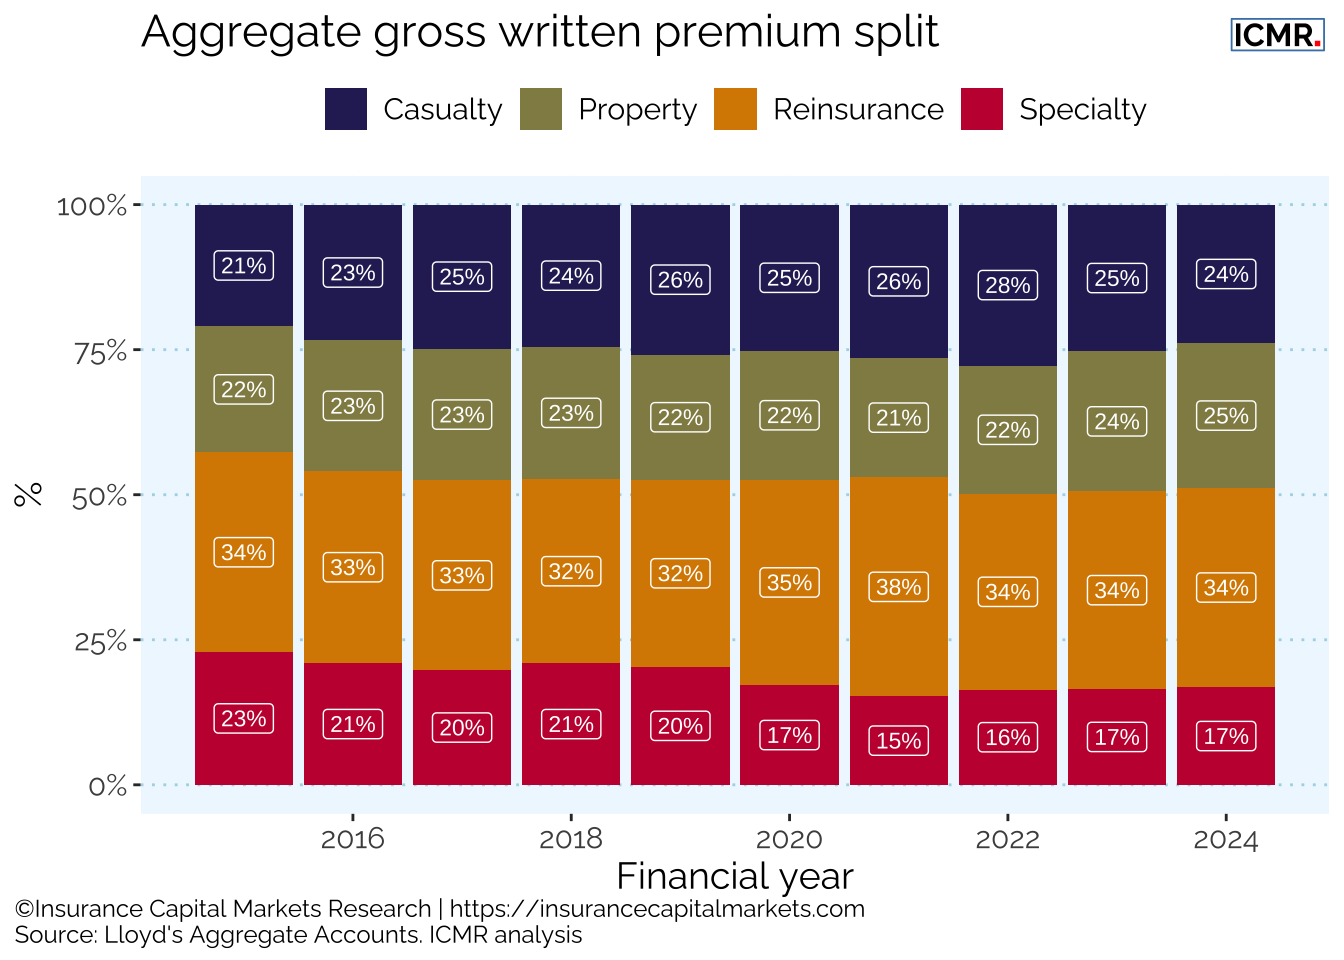
Reinsurance remains the largest single class at Lloyd’s, making c. 34% of the market aggregate GWP. Direct Property and Casualty business each represent about 1/4 of underwriting in 2024, while the Specialty lines dropped 17%, see Figure 5.1.
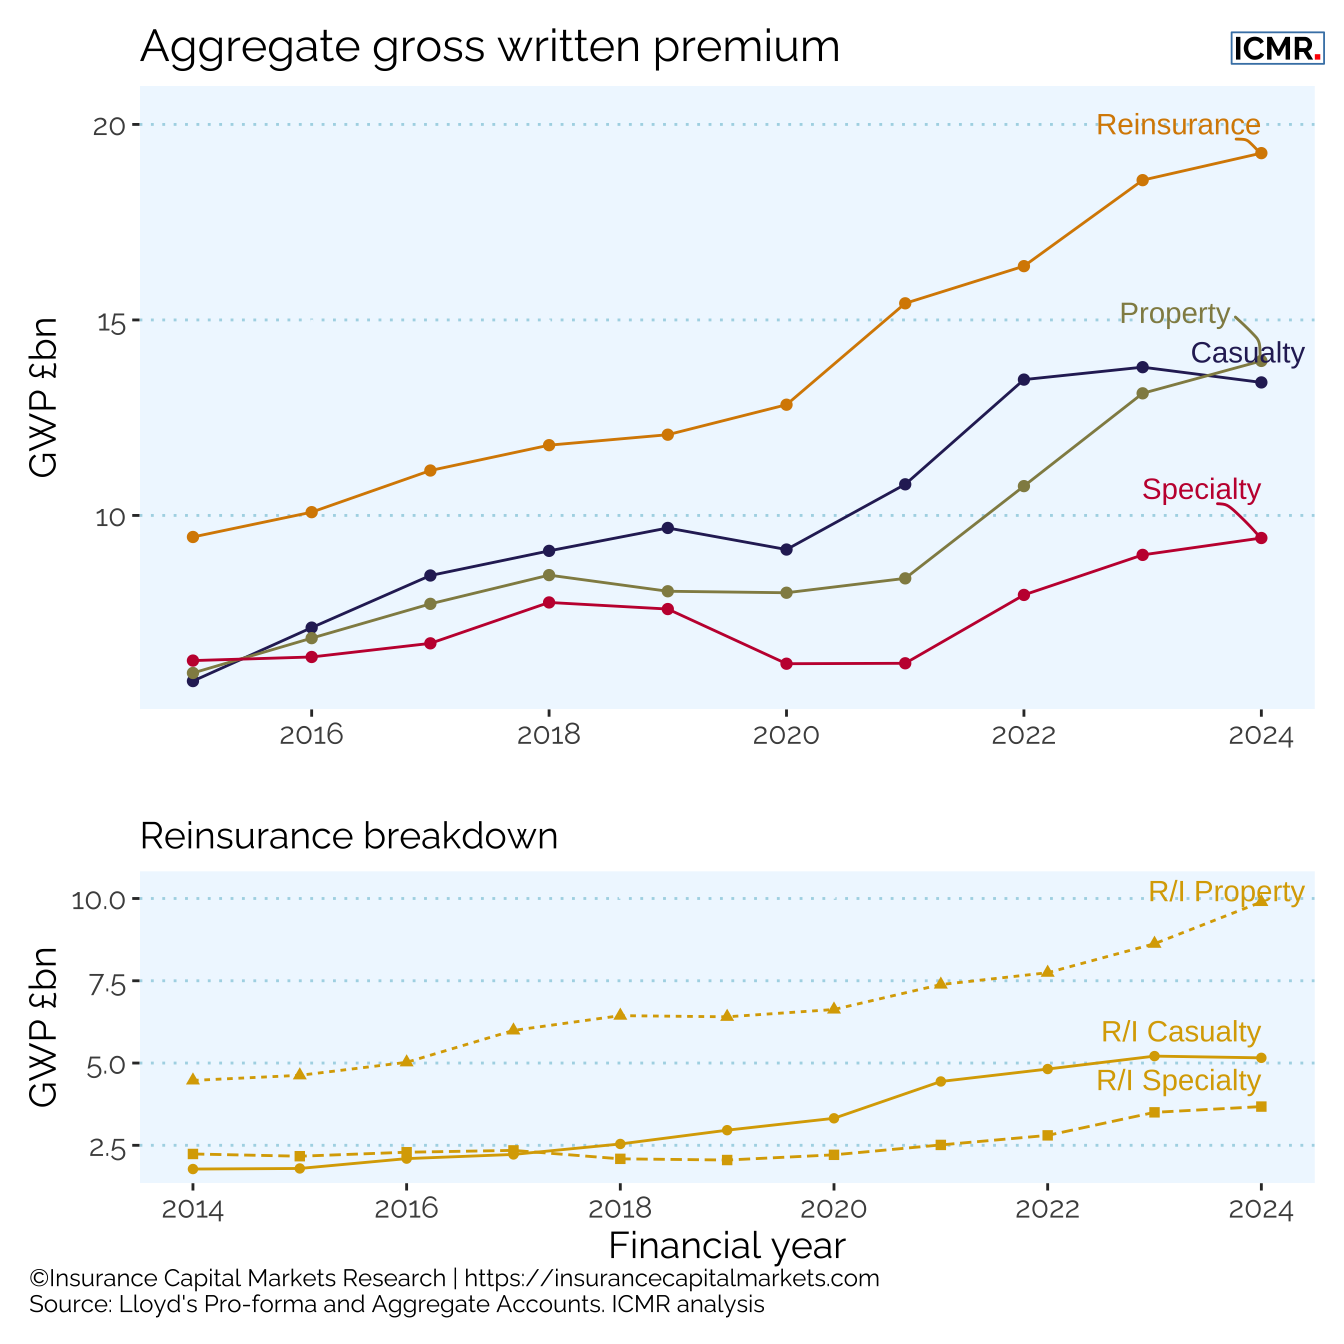
Overall Lloyd’s market GWP has doubled in size since 2015, with significant growth in Property and Reinsurance Property over the recent years, Figure 5.2.
Following a reduction in Specialty business to a low point in 2021 there has been renewed income from this line over the previous three years.
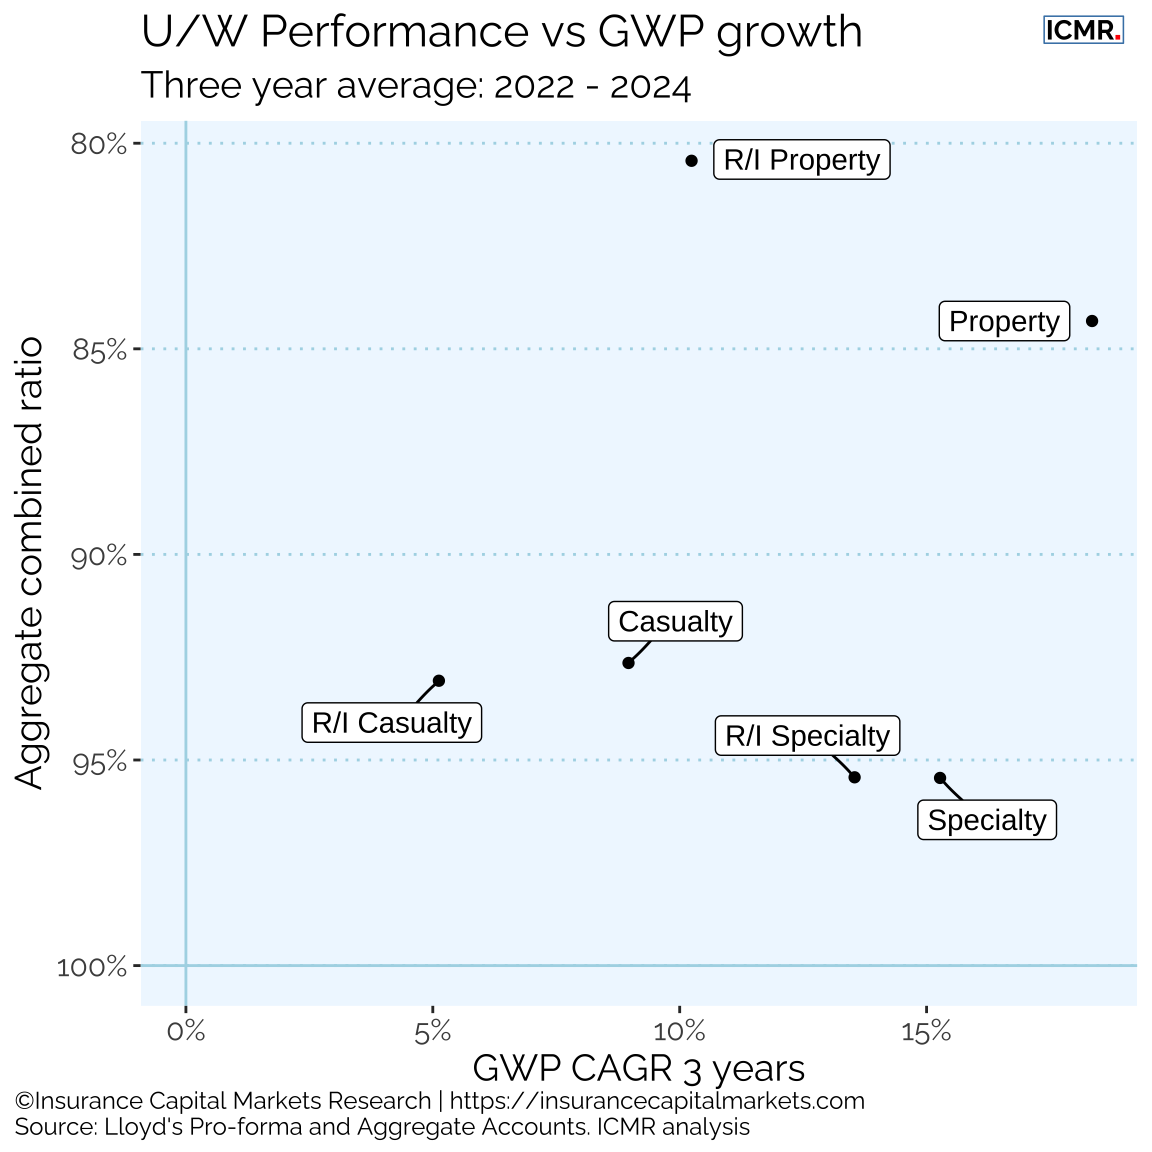
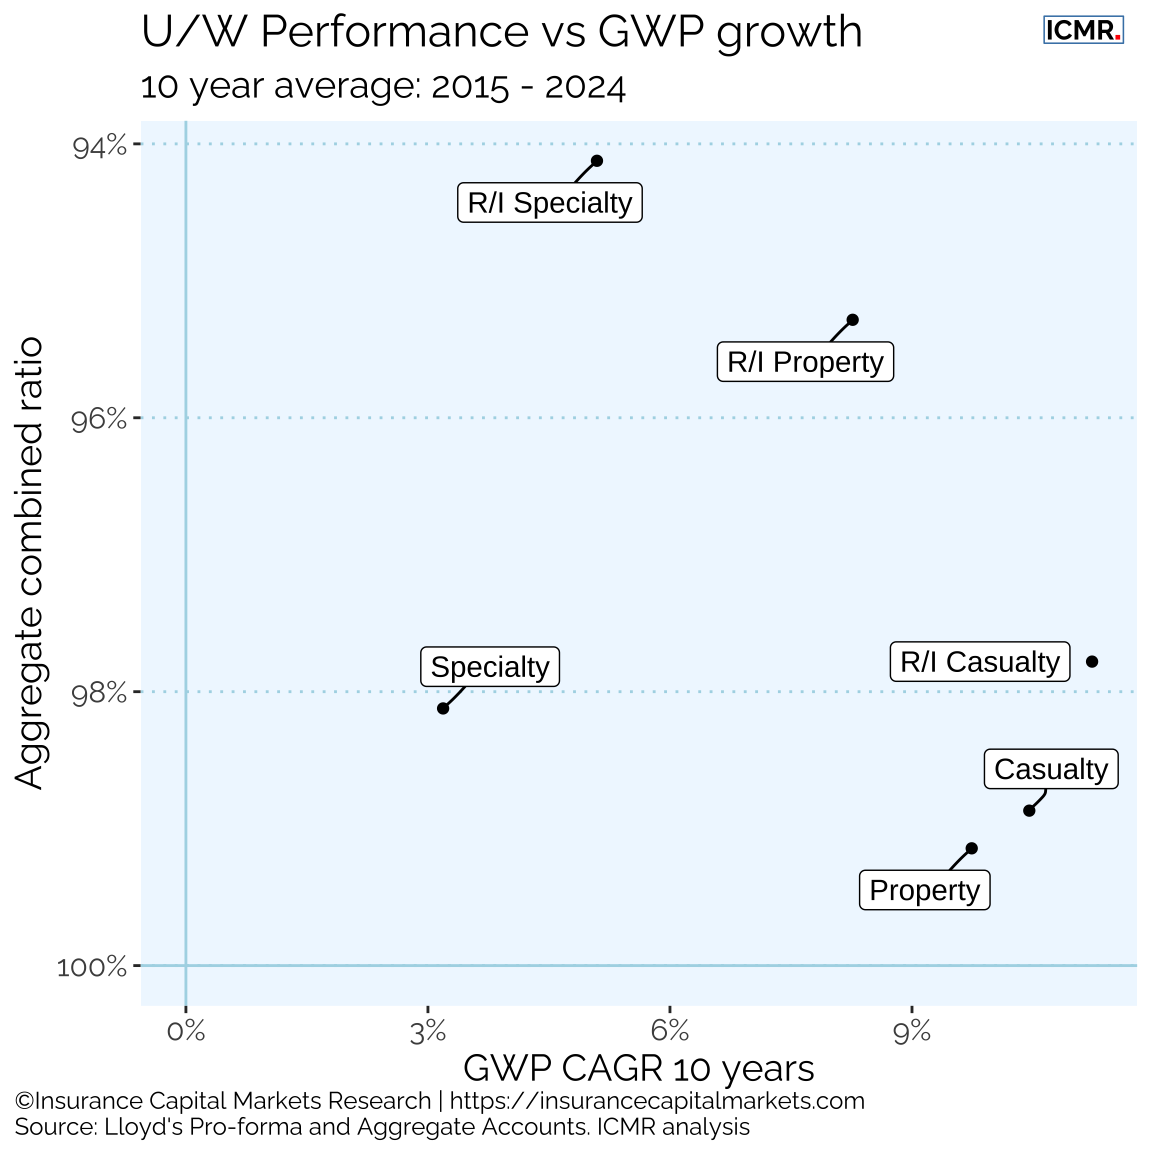
Over the last three years all lines produced underwriting profits, as indeed they also did in the aggregate over the previous 10 years since 2015. Figure 5.3 shows that over a three year time horizon Property and Reinsurance Property were the clear out-performers in terms of growth and profitability from 2022 to 2024, following significant improvements in rate and relatively lower than average major claims experience. Over the longer 10 year time horizon, Reinsurance Property has seen the best combination of growth and returns, Figure 5.4.
5.2 Aggregate underwriting ratios
All four lines reported accident year underwriting profits in 2024, Figure 5.5. However, there has been considerable volatility over the previous 10 years as a result of major loss activities, which impacted the Reinsurance and Property lines in particular.
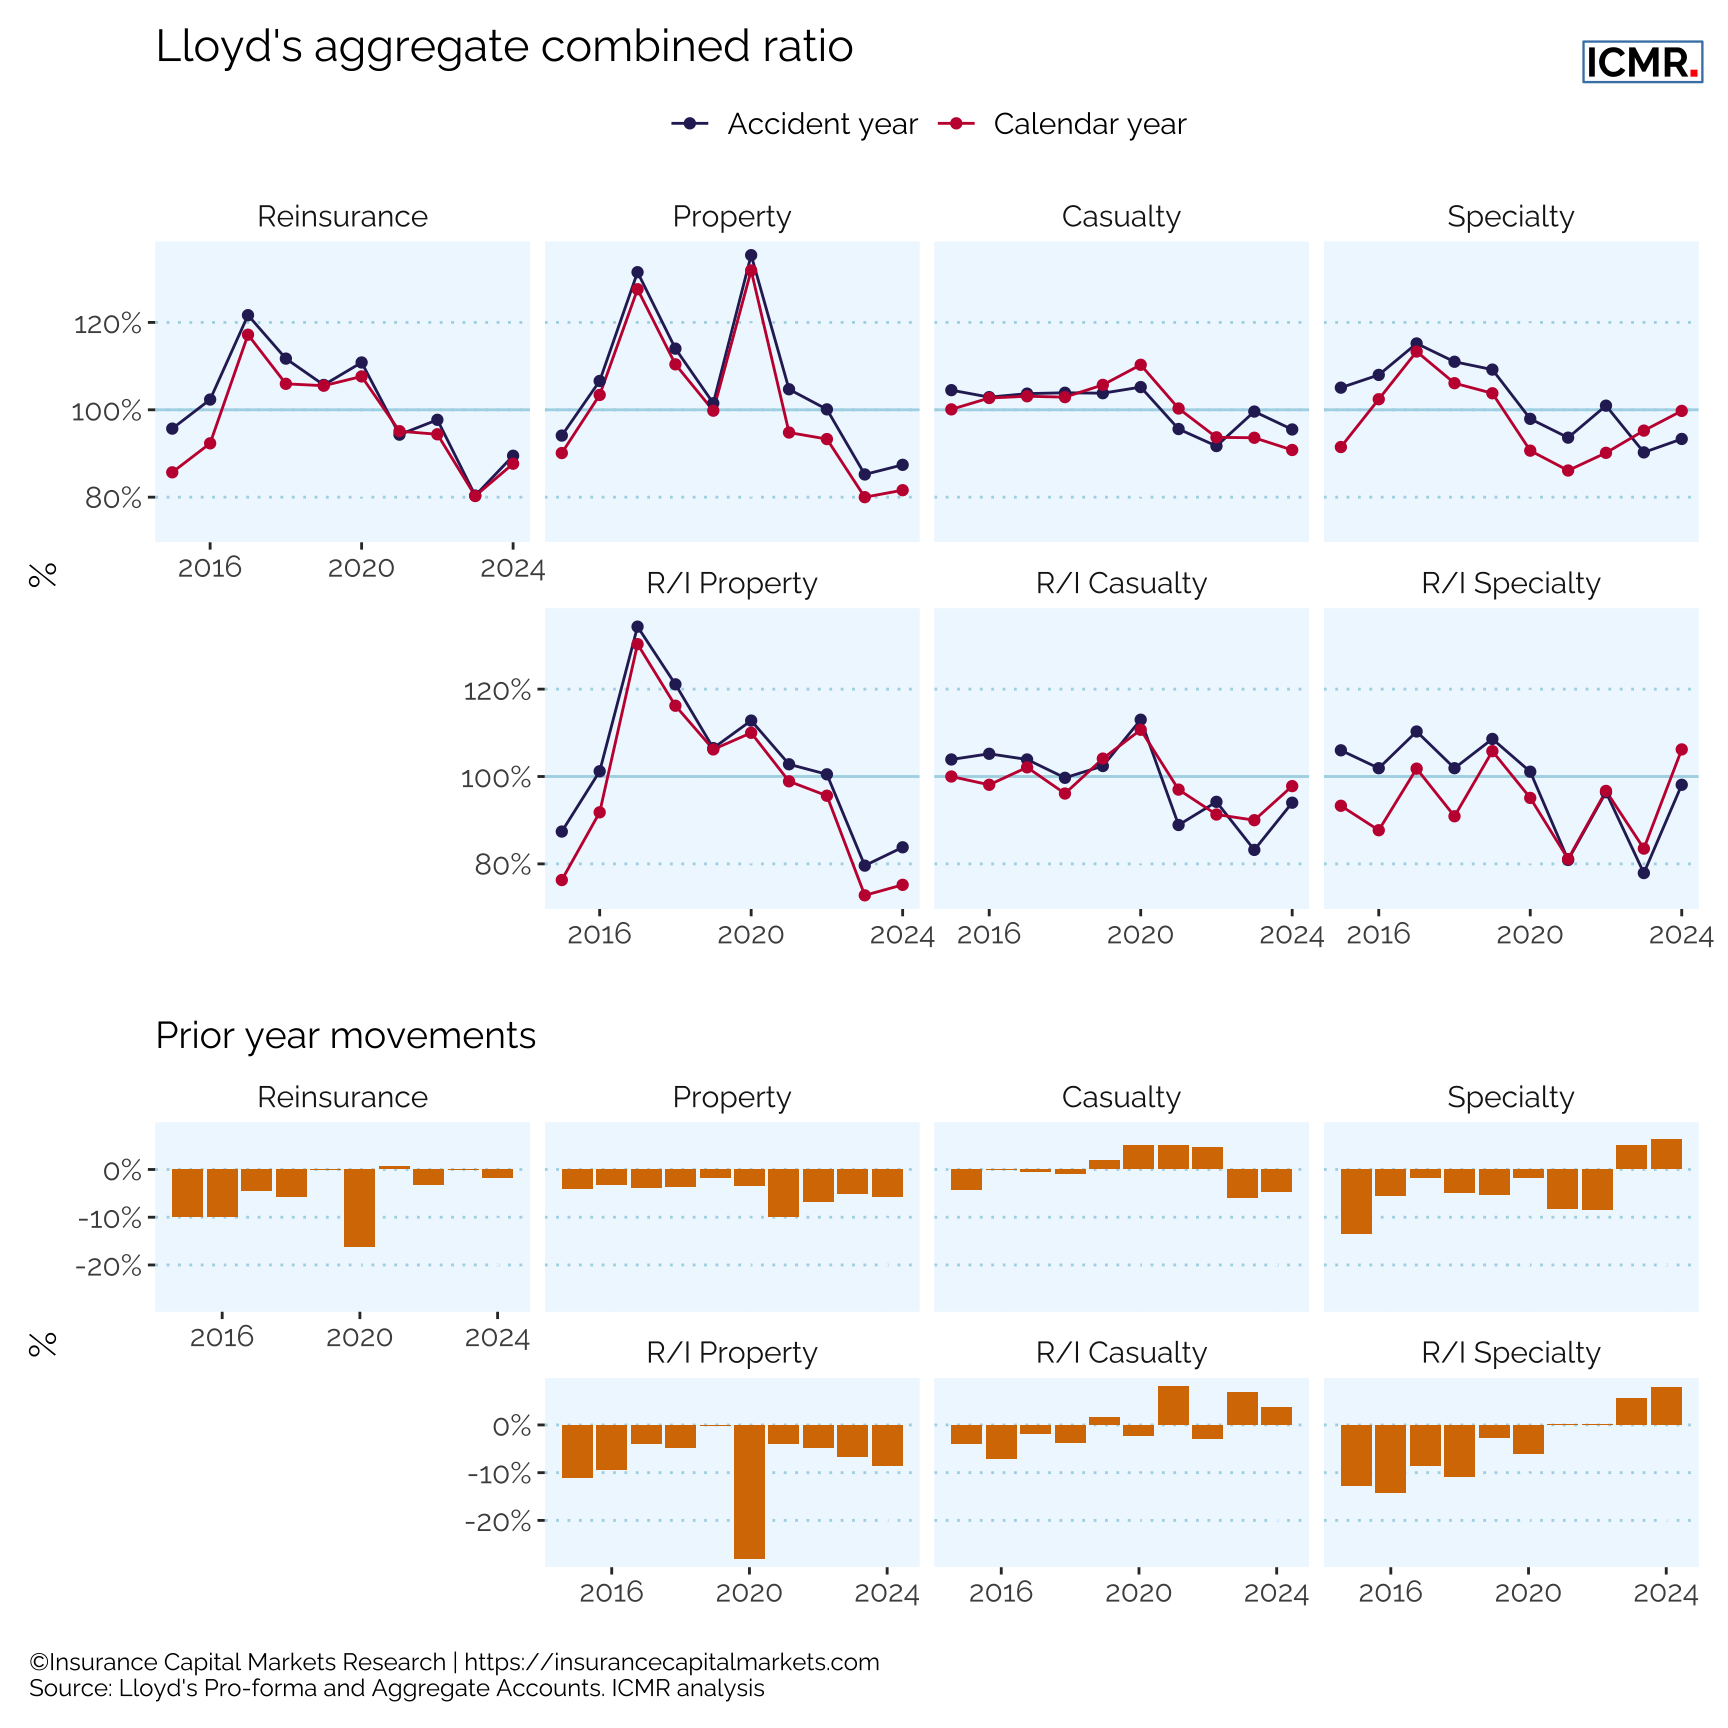
The strengthening in reserves for the Specialty line is explained by Lloyd’s as follows: “Since the end of 2023, there hav e been significant increases in the allowance for the Ukraine conflict in reserves, primarily driven by ultimate loss estimate increases for Aviation losses, partially offset by decreases in Marine and Political Risk classes due to expiry of risk. The increases in Aviation estimates are driven by revised assumptions around the best estimate, informed by recent settlements.” (Source: Lloyd’s 2024 pro-forma annual report)
5.3 Aggregate underwriting statistics
The next sections delve deeper into the data by COB, reviewing the performance over time, the gross U/W performance and changes in market concentration.
Presenting performance on a gross performance basis has the advantage of eliminating the impact of different reinsurance structures, particularly inter-group reinsurance and legacy transactions.
| Financial year | Number of syndicates | GWP £m | YoY change | Top 5 GWP share | Gross loss ratio | Net U/W result £m |
|---|---|---|---|---|---|---|
| 2015 | 73 | 9,449 | NA | 36.9% | 45.8% | 904 |
| 2016 | 73 | 10,084 | 6.7% | 34.9% | 50.8% | 583 |
| 2017 | 69 | 11,149 | 10.6% | 33.1% | 100.2% | (1,336) |
| 2018 | 70 | 11,797 | 5.8% | 33.6% | 80.9% | (456) |
| 2019 | 69 | 12,065 | 2.3% | 30.5% | 73.3% | (435) |
| 2020 | 69 | 12,832 | 6.4% | 30.2% | 70.3% | (656) |
| 2021 | 83 | 15,425 | 20.2% | 28.5% | 69.2% | 498 |
| 2022 | 86 | 16,376 | 6.2% | 28.0% | 70.0% | 636 |
| 2023 | 89 | 18,575 | 13.4% | 26.6% | 48.5% | 2,550 |
| 2024 | 94 | 19,266 | 3.7% | 28.4% | 56.2% | 1,680 |
| Financial year | Number of syndicates | GWP £m | YoY change | Top 5 GWP share | Gross loss ratio | Net U/W result £m |
|---|---|---|---|---|---|---|
| 2015 | 72 | 5,764 | NA | 29.9% | 59.8% | (4) |
| 2016 | 72 | 7,131 | 23.7% | 27.8% | 62.1% | (147) |
| 2017 | 66 | 8,464 | 18.7% | 28.8% | 63.3% | (190) |
| 2018 | 65 | 9,094 | 7.4% | 28.1% | 66.8% | (184) |
| 2019 | 64 | 9,680 | 6.4% | 29.4% | 70.9% | (381) |
| 2020 | 66 | 9,128 | -5.7% | 30.4% | 77.3% | (689) |
| 2021 | 74 | 10,796 | 18.3% | 30.6% | 67.1% | (30) |
| 2022 | 83 | 13,474 | 24.8% | 28.9% | 65.4% | 538 |
| 2023 | 82 | 13,792 | 2.4% | 29.8% | 57.2% | 577 |
| 2024 | 84 | 13,402 | -2.8% | 24.4% | 56.9% | 797 |
| Financial year | Number of syndicates | GWP £m | YoY change | Top 5 GWP share | Gross loss ratio | Net U/W result £m |
|---|---|---|---|---|---|---|
| 2015 | 70 | 5,971 | NA | 33.0% | 38.1% | 587 |
| 2016 | 73 | 6,862 | 14.9% | 32.9% | 54.5% | (98) |
| 2017 | 68 | 7,739 | 12.8% | 34.6% | 103.8% | (1,785) |
| 2018 | 66 | 8,474 | 9.5% | 34.0% | 75.3% | (936) |
| 2019 | 64 | 8,061 | -4.9% | 30.4% | 57.4% | (31) |
| 2020 | 67 | 8,023 | -0.5% | 29.6% | 73.8% | (707) |
| 2021 | 75 | 8,391 | 4.6% | 28.6% | 55.6% | 498 |
| 2022 | 75 | 10,750 | 28.1% | 25.5% | 62.1% | 462 |
| 2023 | 80 | 13,123 | 22.1% | 27.4% | 37.6% | 1,657 |
| 2024 | 88 | 13,952 | 6.3% | 25.4% | 40.0% | 1,898 |
| Financial year | Number of syndicates | GWP £m | YoY change | Top 5 GWP share | Gross loss ratio | Net U/W result £m |
|---|---|---|---|---|---|---|
| 2015 | 70 | 6,288 | NA | 28.7% | 54.0% | 270 |
| 2016 | 70 | 6,380 | 1.5% | 31.9% | 68.6% | (205) |
| 2017 | 64 | 6,729 | 5.5% | 33.3% | 70.1% | (535) |
| 2018 | 63 | 7,775 | 15.5% | 39.2% | 66.8% | (31) |
| 2019 | 62 | 7,606 | -2.2% | 36.2% | 71.8% | (115) |
| 2020 | 61 | 6,208 | -18.4% | 32.5% | 96.1% | (1,031) |
| 2021 | 71 | 6,219 | 0.2% | 31.2% | 54.1% | 613 |
| 2022 | 75 | 7,967 | 28.1% | 26.7% | 67.5% | 517 |
| 2023 | 81 | 8,991 | 12.9% | 24.5% | 51.0% | 748 |
| 2024 | 83 | 9,423 | 4.8% | 27.1% | 64.4% | 301 |
Despite an increase in the number of syndicates within each sector, the top 5 syndicates by GWP still hold approximately a 25% market share.
All classes experienced a reduction in premium growth during 2024, with Casualty GWP decreasing by -2.8%.