6 Expense Analysis
The three principal drivers of expense ratios are acquisition costs, operating expenses and reinsurance spend. The first two affect the numerator of the ratio, the last item affects its denominator.
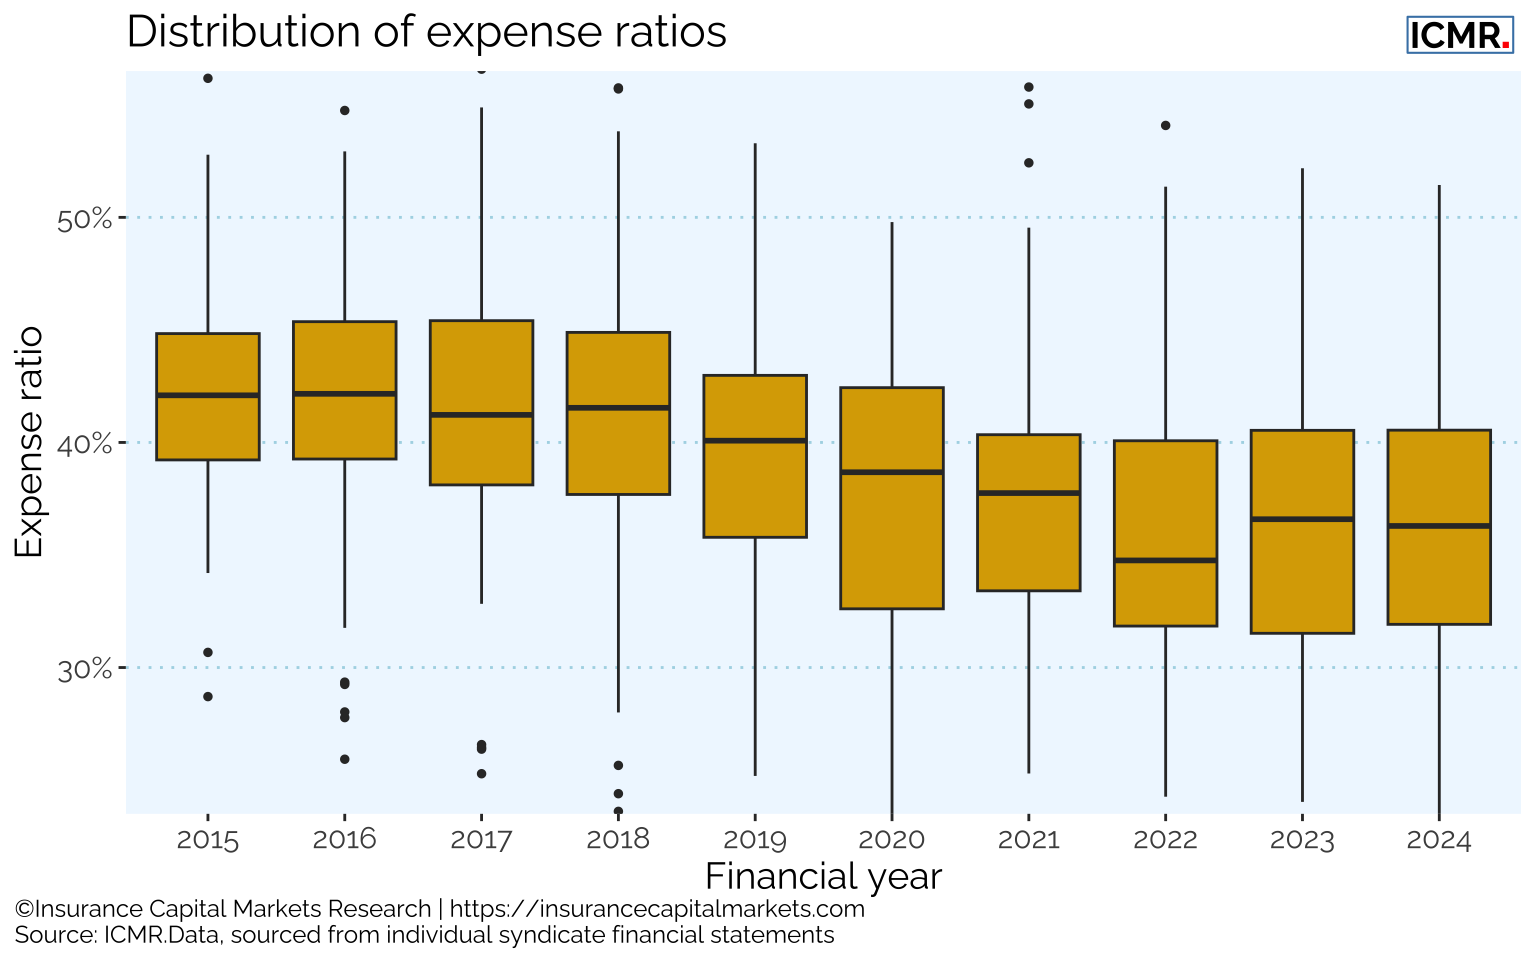
Expense ratios have been generally declining from a peak of over 40% of net earned premium, though this has plateaued in recent years.
6.1 Net expense ratio
It can be very difficult for syndicates to reduce acquisition costs over time, particularly with the growth of delegated business which carries significantly higher acquisition costs than, say, reinsurance business. Equally, operating expenses tend not to be subject to rapid flux, as syndicates build out their infrastructure and staffing levels.
The most significant impact on expense ratios tends to come from a syndicate’s reinsurance spend; the less spent, the greater the net earned premium, the lower the expense ratio.
6.2 Does size matter?
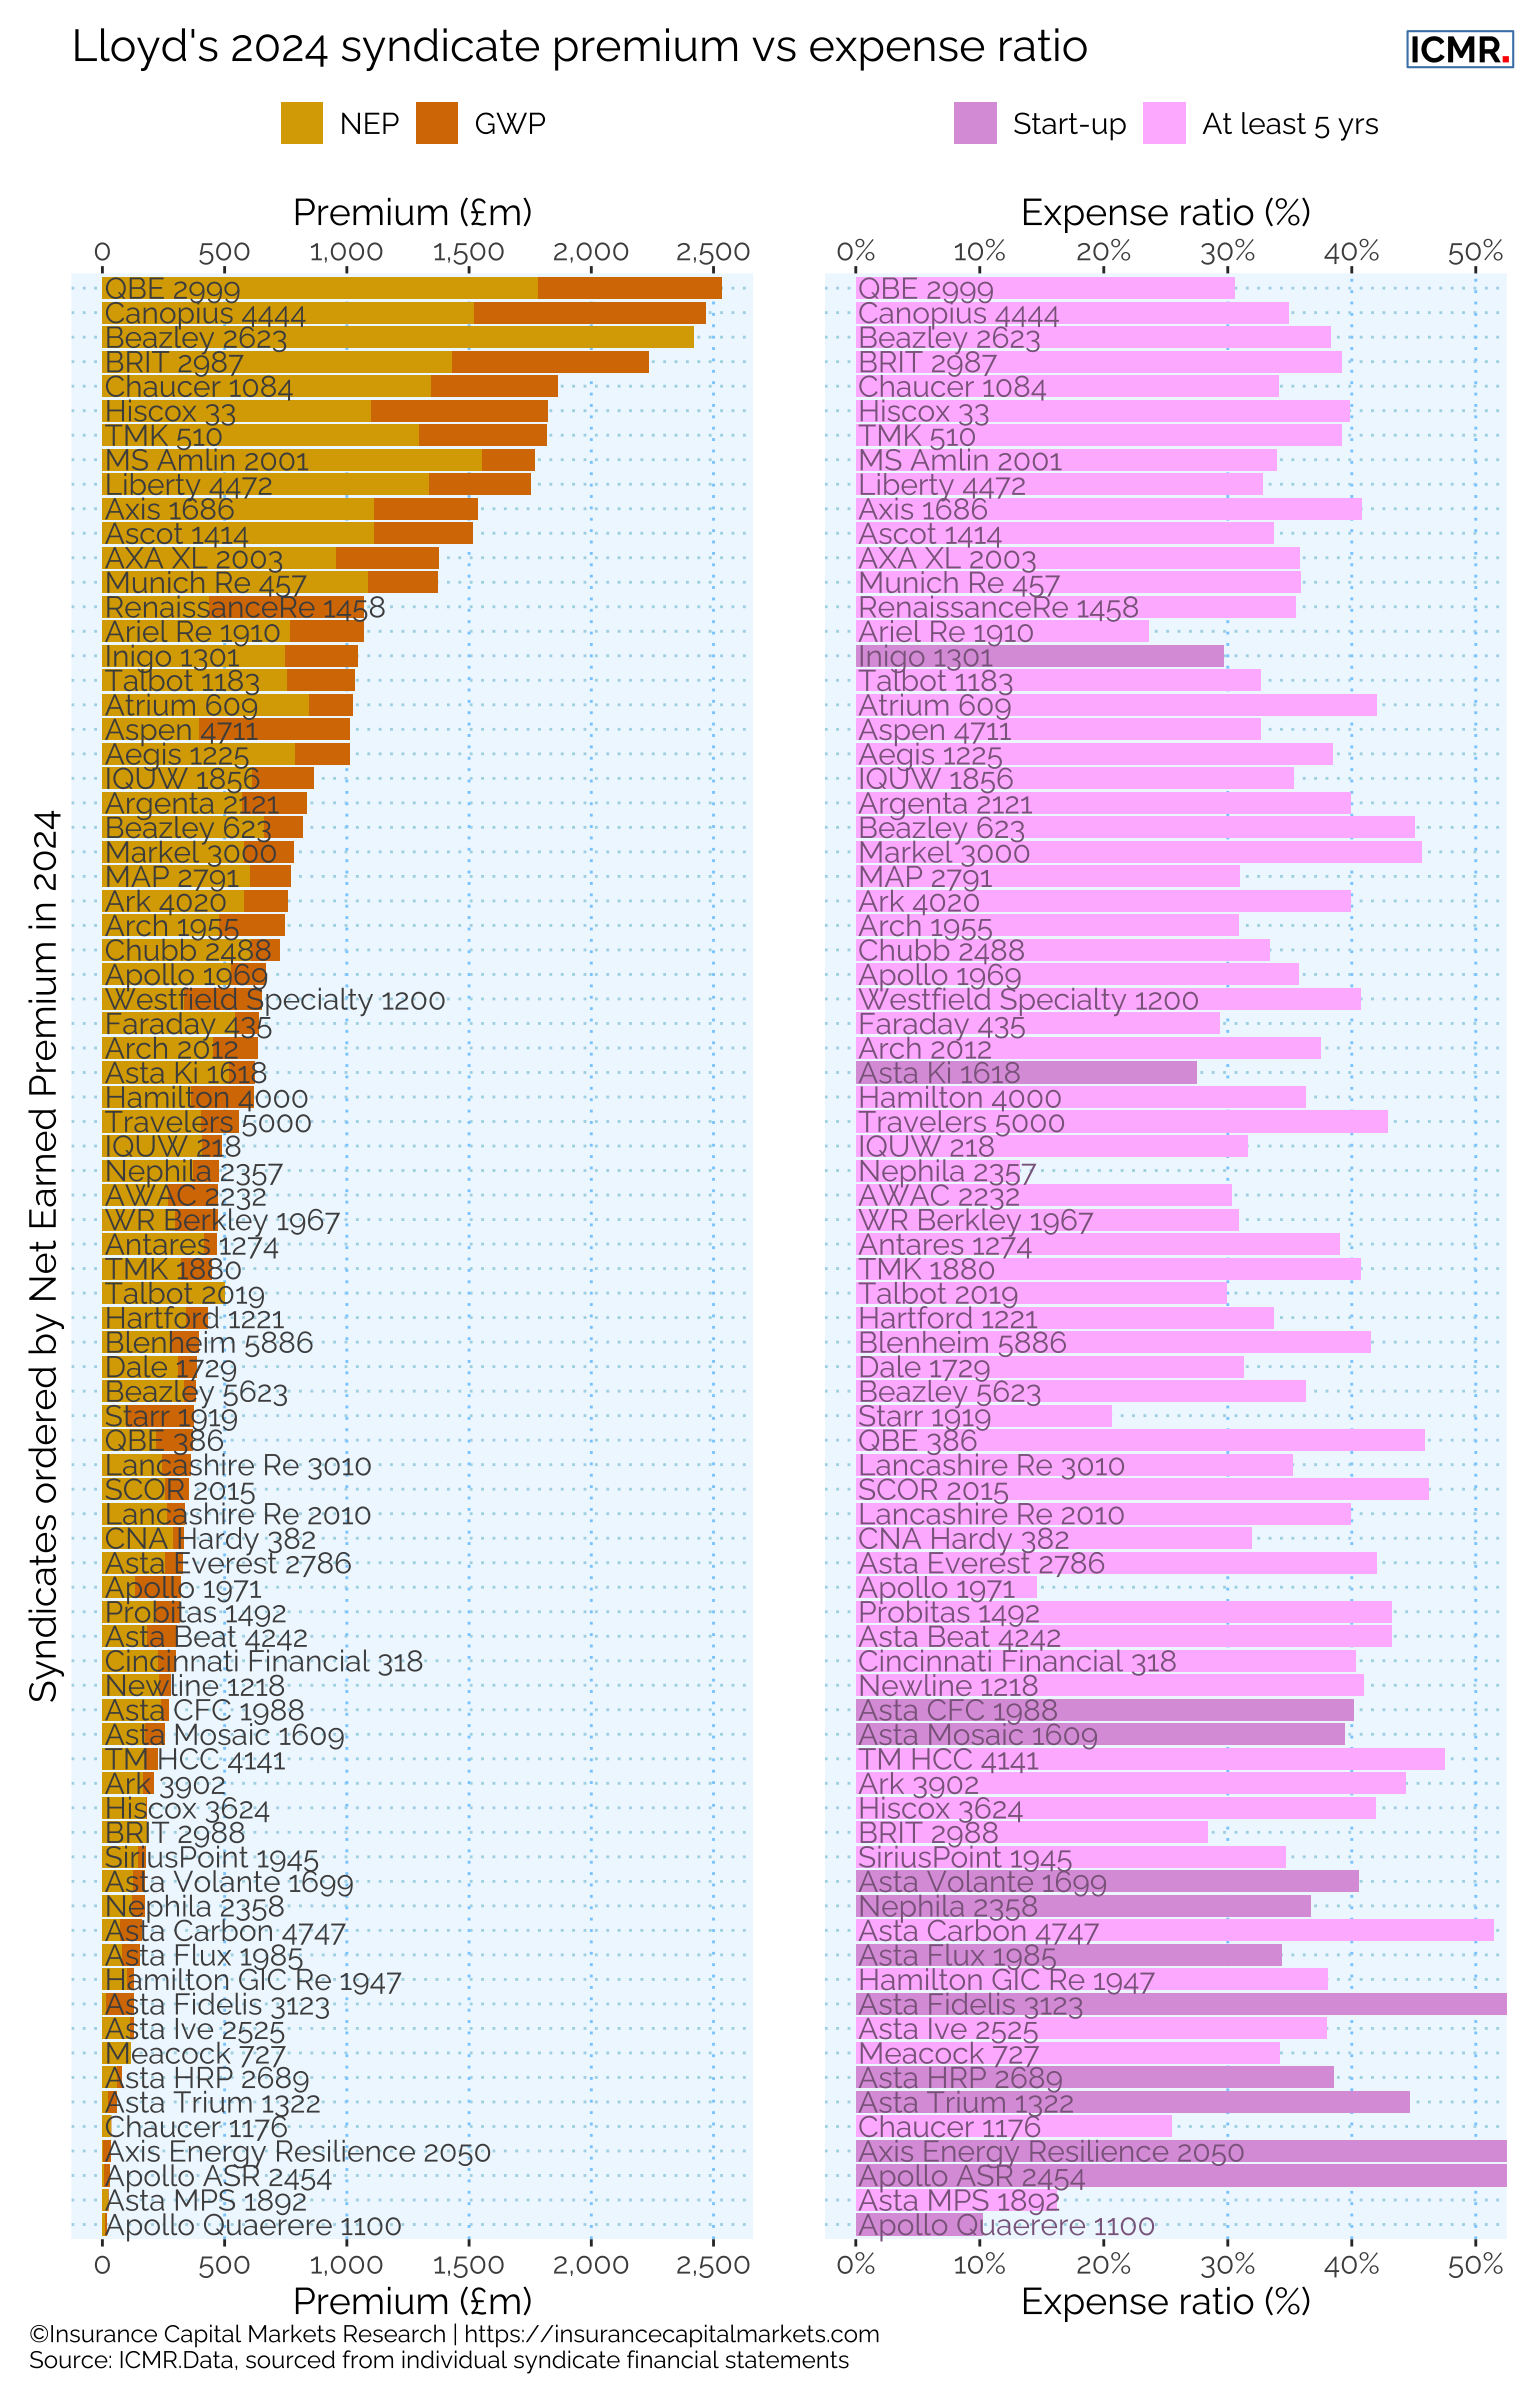
As is apparent from the above chart, the model of underwriting at Lloyd’s does not lead to consistently lower expense ratios at scale. Similar expense ratios apply for syndicates orders of magnitude bigger than others.
This reflects the high proportion of expenses that are variable with premium, such as broker remuneration and protecting downside risk with reinsurance. It also suggests that the Lloyd’s central service infrastructure enables much smaller, bespoke carriers to operate profitably in a way which would not be possible outside Lloyd’s.
Economies of scale are only available through stable process management and a trend to watch for in future is the extent to which market digitalization and consequent changes to Lloyd’s cost charging structures allow the larger syndicates to realise economies of scale.
6.3 Acquisition cost by placement method
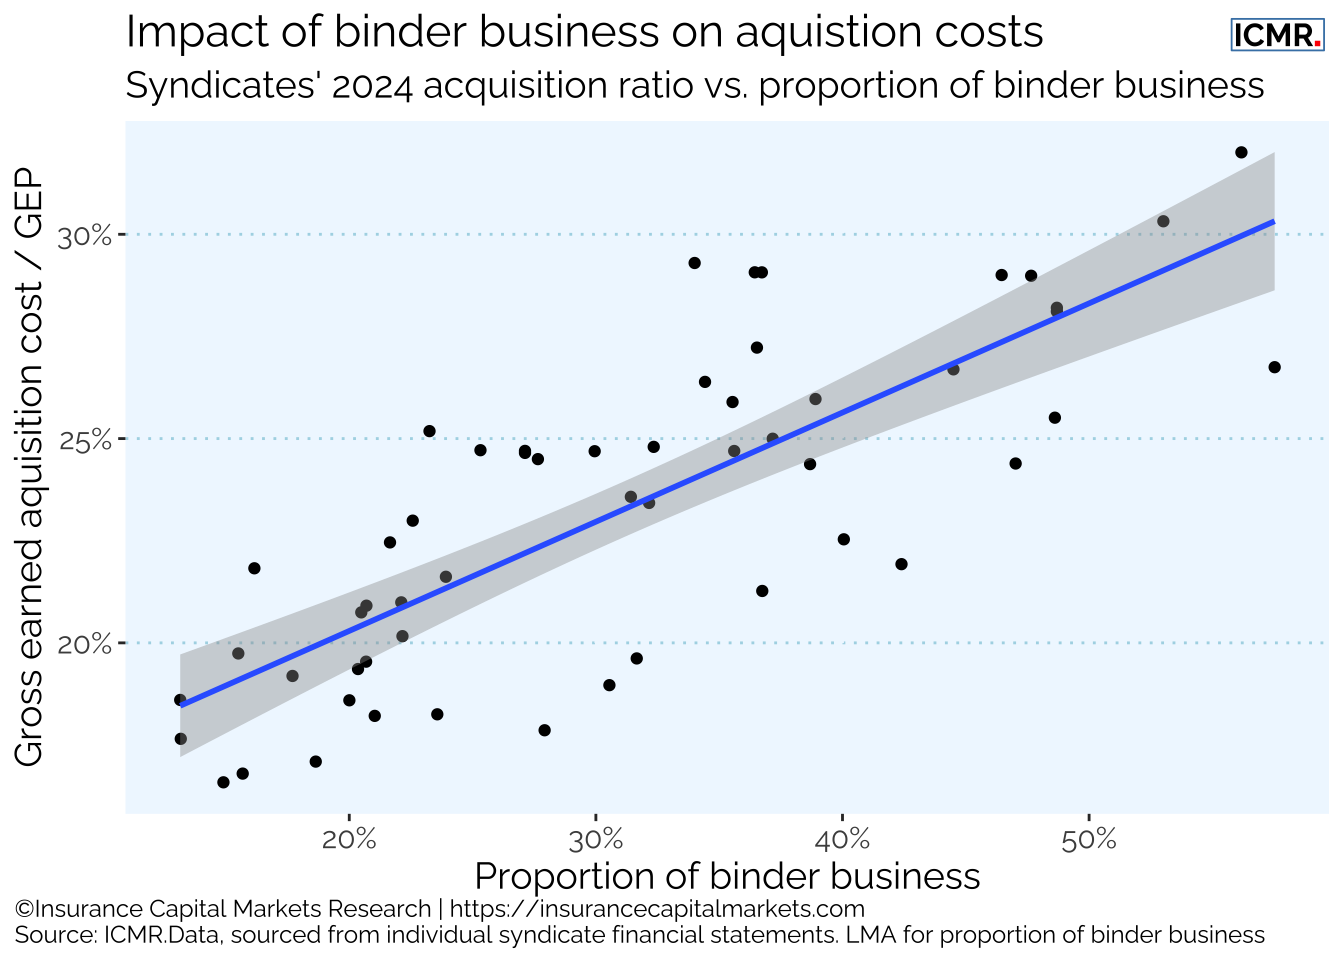
Figure 6.3 clearly shows the relationship between greater use of binding authorities as a distribution channel and higher expenses.
| Binder premium as % of GWP | Gross acquisition ratio | Gross admin expense ratio | Gross expense ratio | Gross loss ratio | Gross combined ratio |
|---|---|---|---|---|---|
| 10% and below | 20.1% | 6.4% | 26.5% | 50.6% | 77.1% |
| 10% to 20% | 18.2% | 9.9% | 28.1% | 51.1% | 79.2% |
| 20% to 30% | 22.2% | 8.8% | 31.0% | 49.1% | 80.2% |
| 30% to 40% | 24.3% | 6.1% | 30.4% | 51.1% | 81.5% |
| 40% to 50% | 25.6% | 7.4% | 33.0% | 51.2% | 84.2% |
| 50% and above | 25.8% | 6.7% | 32.5% | 48.0% | 80.5% |
Table 6.1 shows the weighted average gross combined ratio and gross acquisition cost for syndicates which have been grouped by the percentage of total gross written premium written through binders. Consistent with Figure 6.3, this shows that as the percentage of premium written through binders increases, the acquisition costs of the portfolio as a whole increases, with an impact of over 5% on the gross acquisition cost ratio for those syndicates that write the most business through binders compared to those which write the least.
The impact of increased acquisition costs can be seen on gross combined ratios with a similar increase across the bands, though we note that this trend is likely to differ based on the experience seen in any given year. While the trend is evident when looking at 2023 and 2024, there is a trade-off for this cost, as such business is typically less volatile. This is due to there being a greater number of risks covered and therefore a greater spread of risk. It is also likely that there is a consequent favourable impact on capital requirements and reinsurance costs and therefore on ultimate profitability.
This illustrates the trade-off between the notionally lower volatility of higher volume smaller value business introduced to syndicates via binding authorities, versus the higher costs of distribution. The key for syndicates is to find that sweet spot in their business and distribution mix.