2 Lloyd’s Results
2.1 Lloyd’s delivers amongst its best ever performance
On a calendar year GAAP basis, Lloyd’s continues to deliver highly favourable returns to investors, with profits to market participants just shy of last year’s all time high. This has arisen from both favourable trading conditions across most classes of business as well as a return to more normal investment valuations following the mark-to-market losses of 2022, and despite an increase in the major claims ratio from 3.5% in 2023 to 7.8% in 2024.
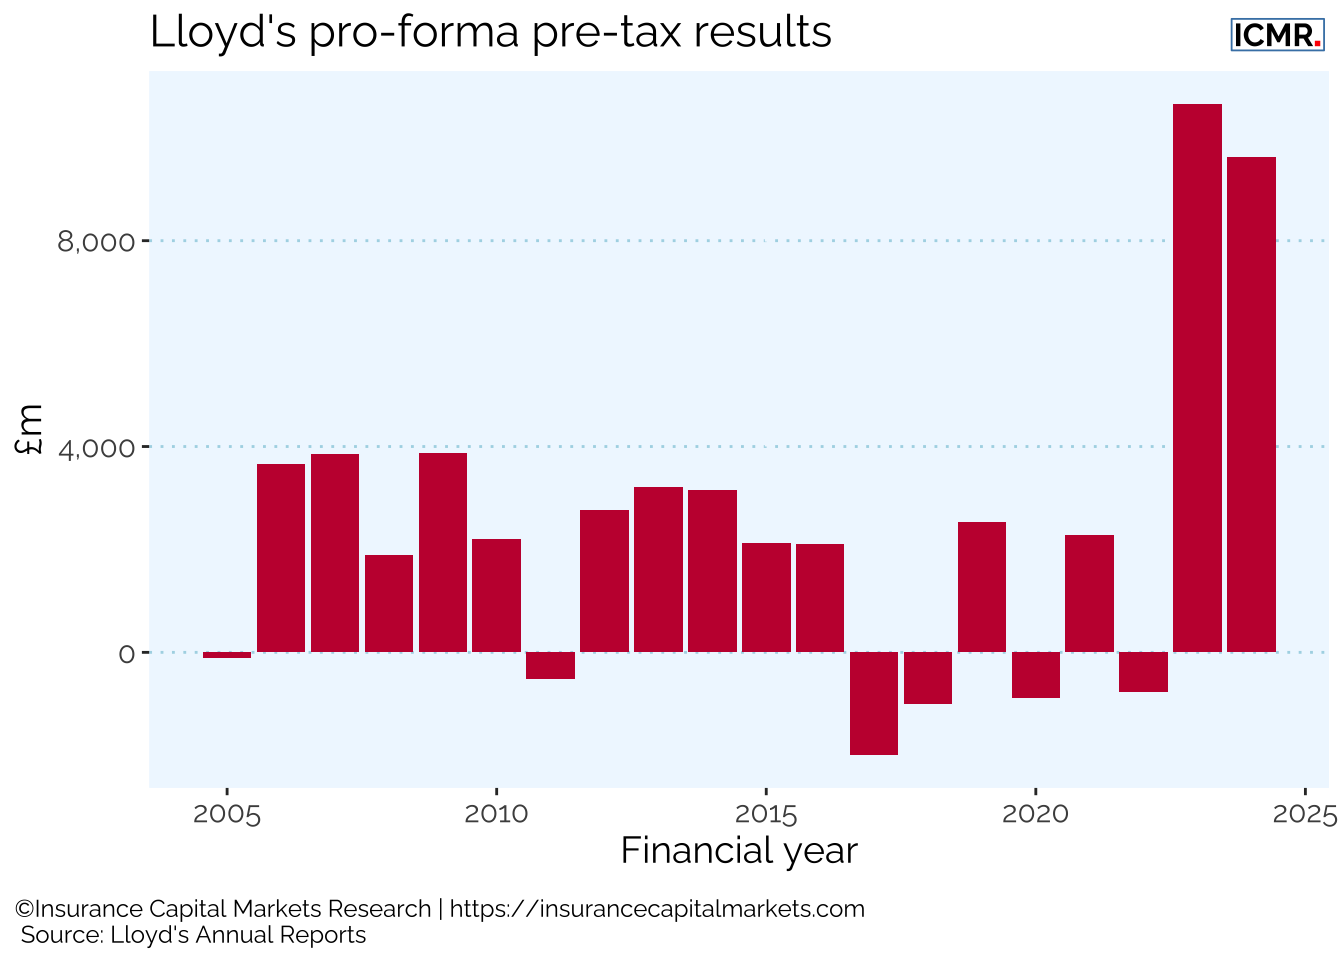
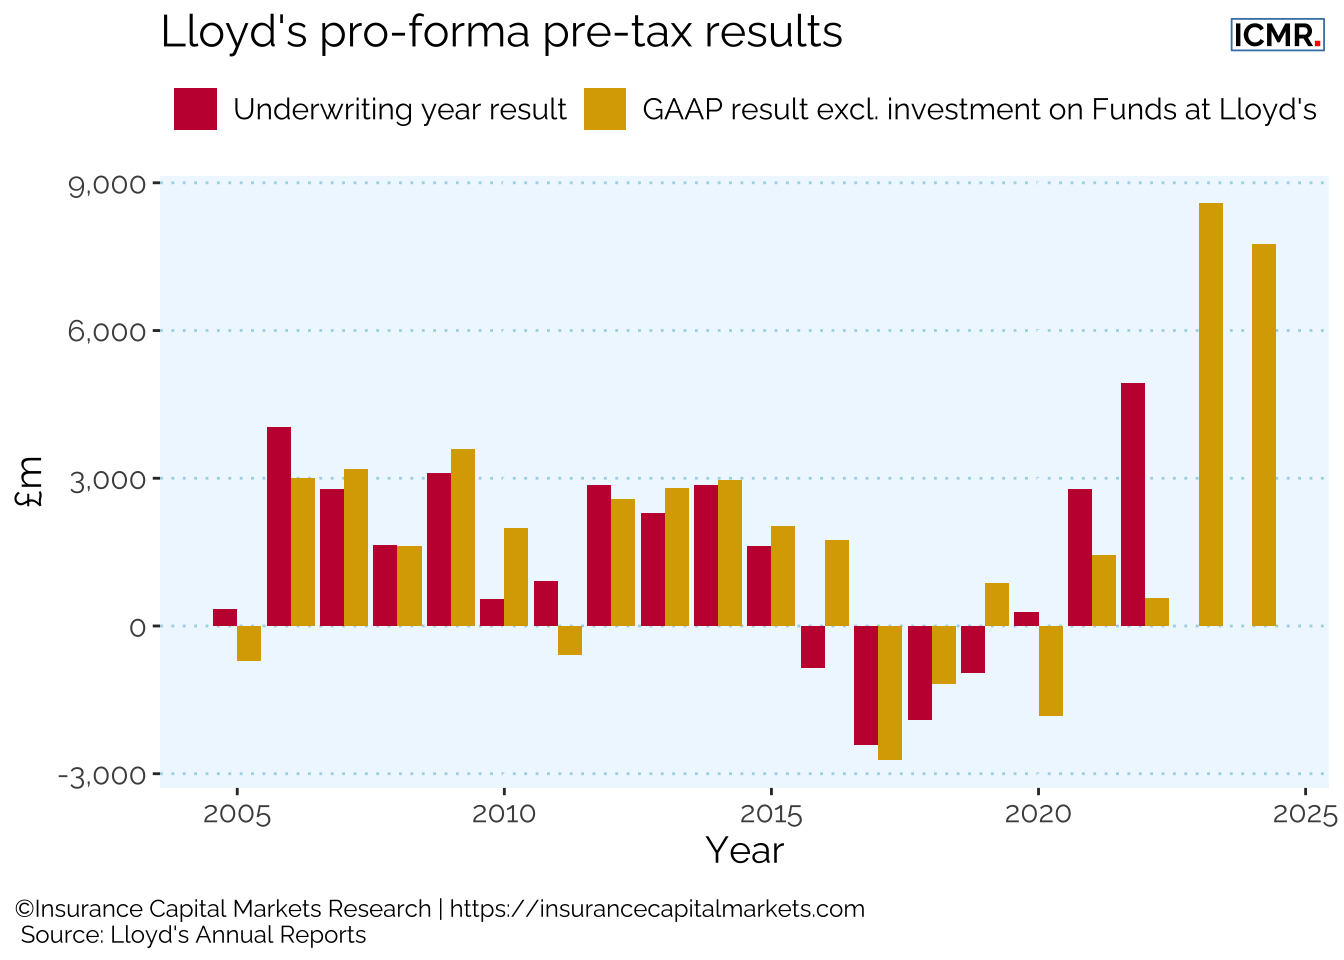
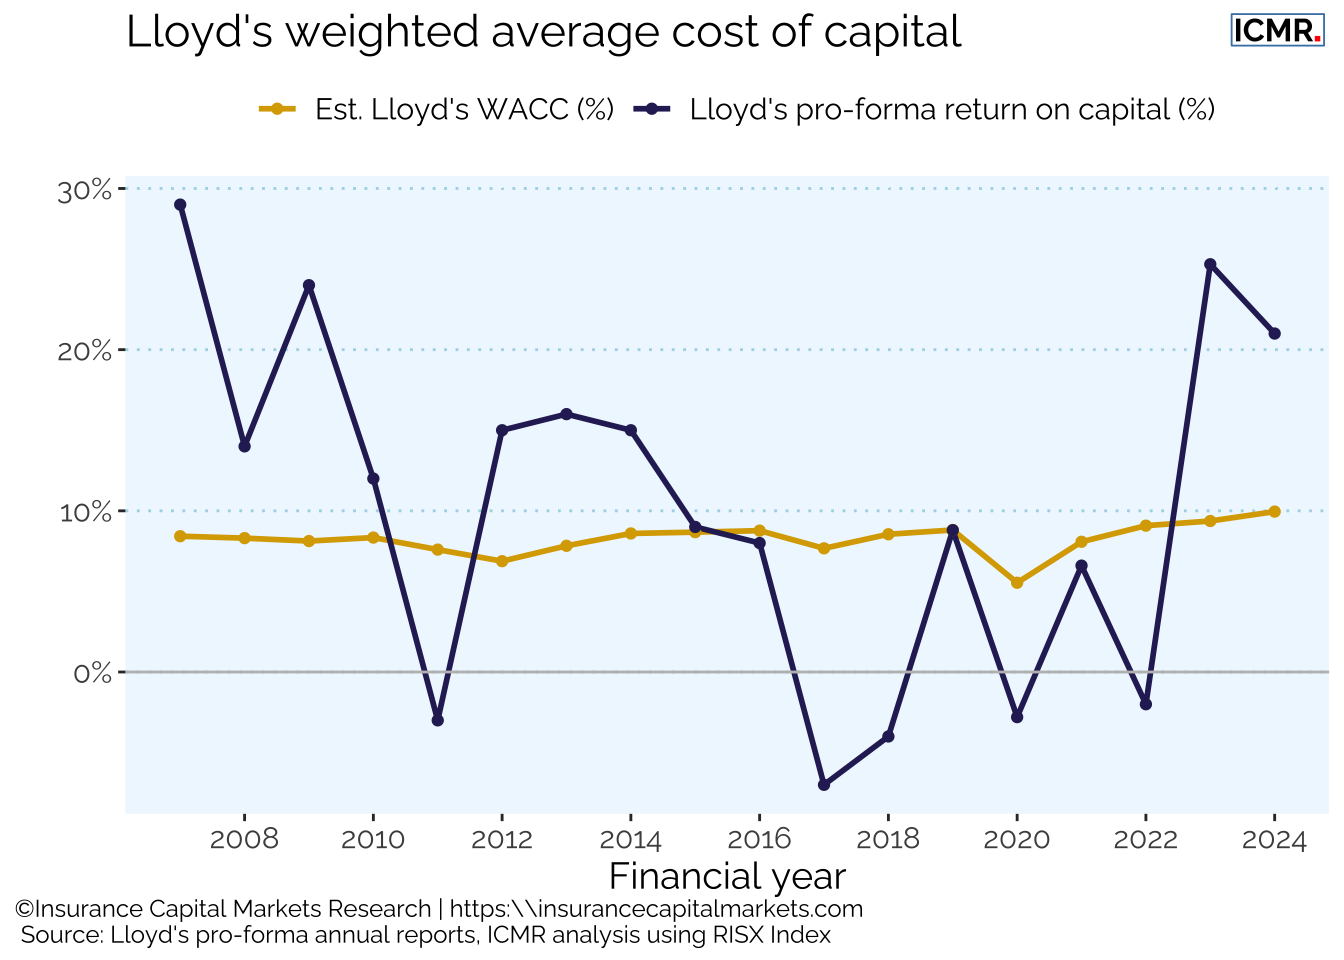
For the 2024 (2023) financial year Lloyd’s reported £55,546m (£52,149m) of gross written premium, with an underwriting result of £5,296m (£5,910m) and pre-tax profit of £9,626m (£10,663m). The combined ratio was 86.9% (84.0%), the investment return deteriorated slightly to 4.7% (5.4%) and the return on capital reached 21.0% (25.3%). The 2022 underwriting year closed with a profit £4,933m.
Comparing calendar year GAAP results with the year of account results, the mismatch for 2022 (where the calendar year GAAP result booked the full mark-to-market investment losses) shows that the underlying underwriting result was still highly positive.
Looking at the 20 year time horizon, essentially encompassing at least two full underwriting cycles, in Figure 2.3 we can see that cumulatively, Lloyd’s has written just over £600bn of gross premium and made a cumulative net profit of £49bn. This includes notional investment return on Funds at Lloyd’s and Lloyd’s central assets and takes account of reinsurance premium paid as well as recoveries made and all expenses, as follows:
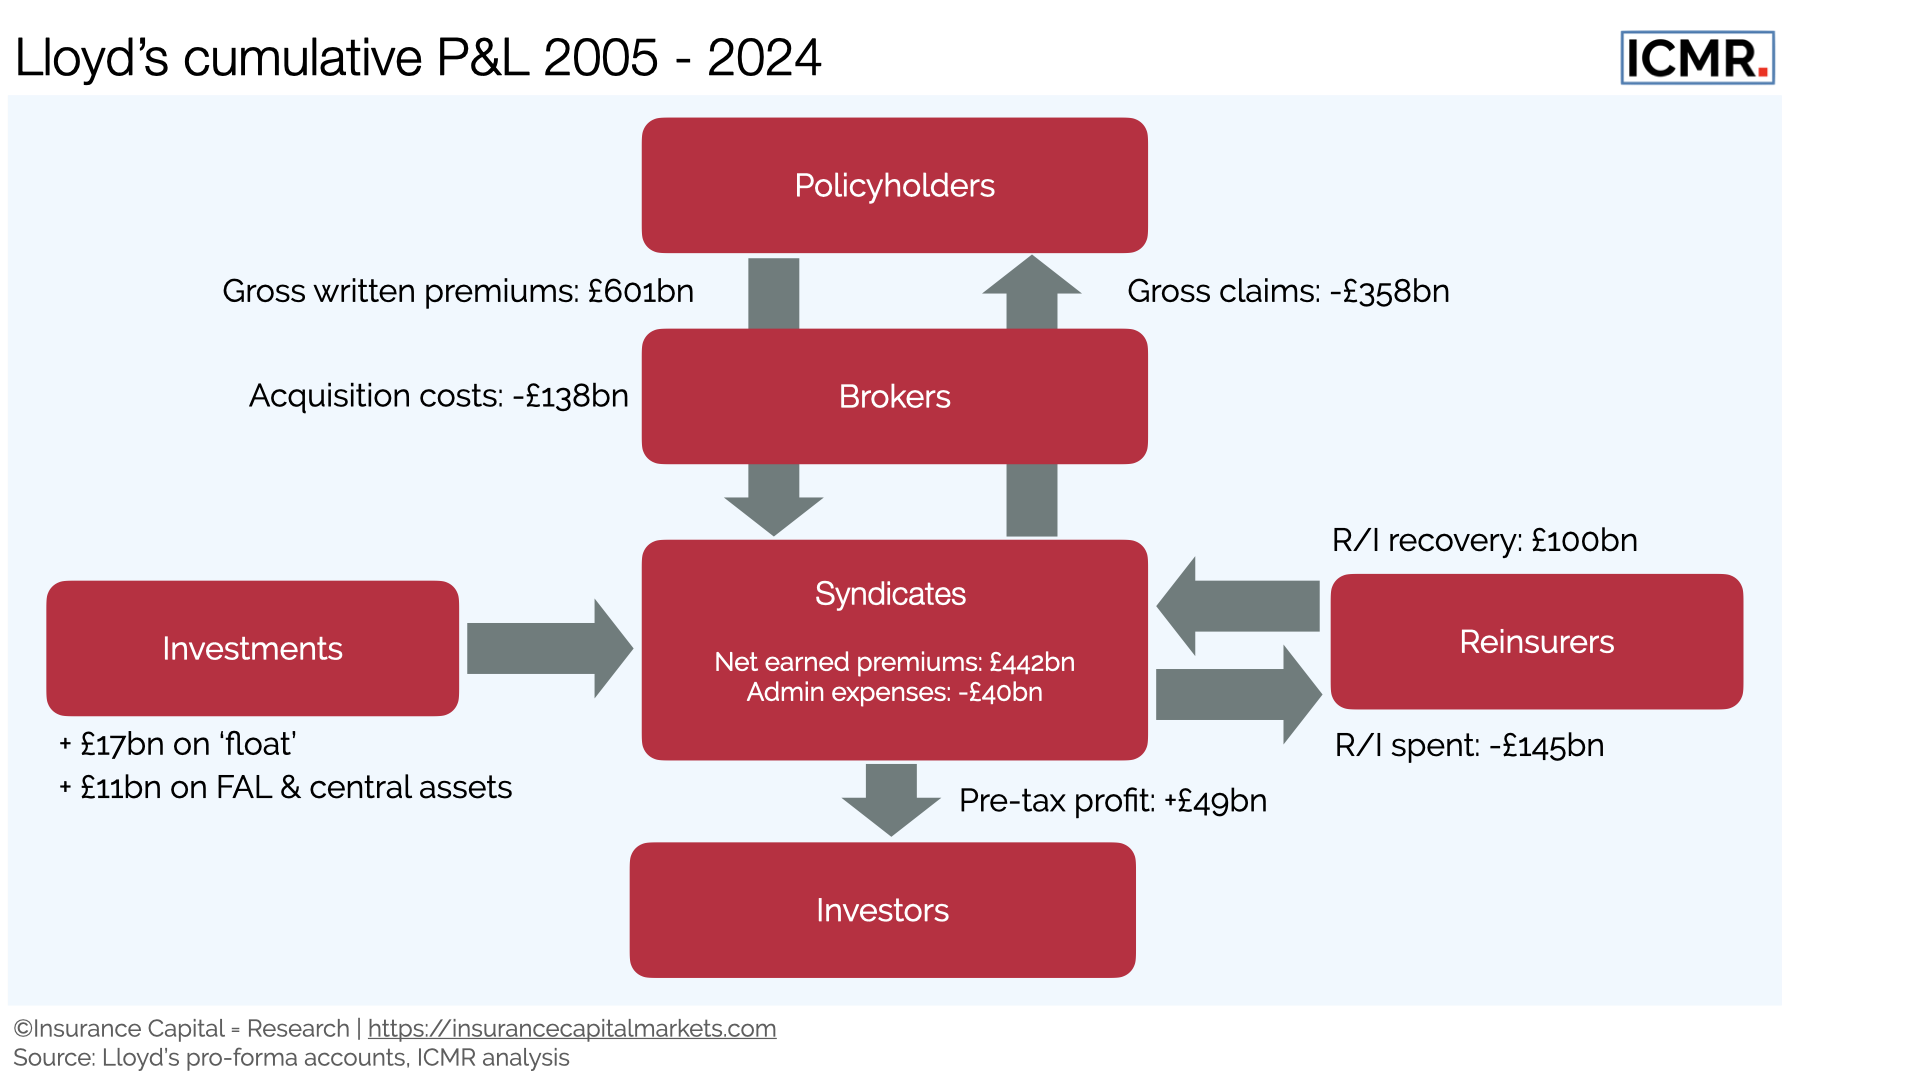
The market has paid its reinsurers (noting that a portion of reinsurance premium is churned between syndicates) £145bn and collected back £100bn in recoveries. This represents sharing approximately just under half the pre-tax gross profit with reinsurers, reflecting the benefit reinsurers have delivered in reducing the market’s volatility and therefore capital requirements. The market’s largest cost, gross claims to policyholders, have amounted to £358bn over the period.
Syndicate investment return has been just over £17bn, varying as a percentage of financial assets between -3.3% (2022) and 6.4% (2007). This compares with administrative expenses which were more than twice that cumulatively at £40bn, rising to a peak of 11.4% of net earned premium in 2015 before falling back to 8.8% in 2023 and rising slightly to 9.0% in 2024.
Overall, investment in the Lloyd’s market has been positive in the aggregate, producing cumulative profits to investors of c.£49bn over the last 20 years. This represents an aggregate return on capital of 10.4%, or around 7.4% above risk free rate.
2.2 Long-term aggregate performance since 1950
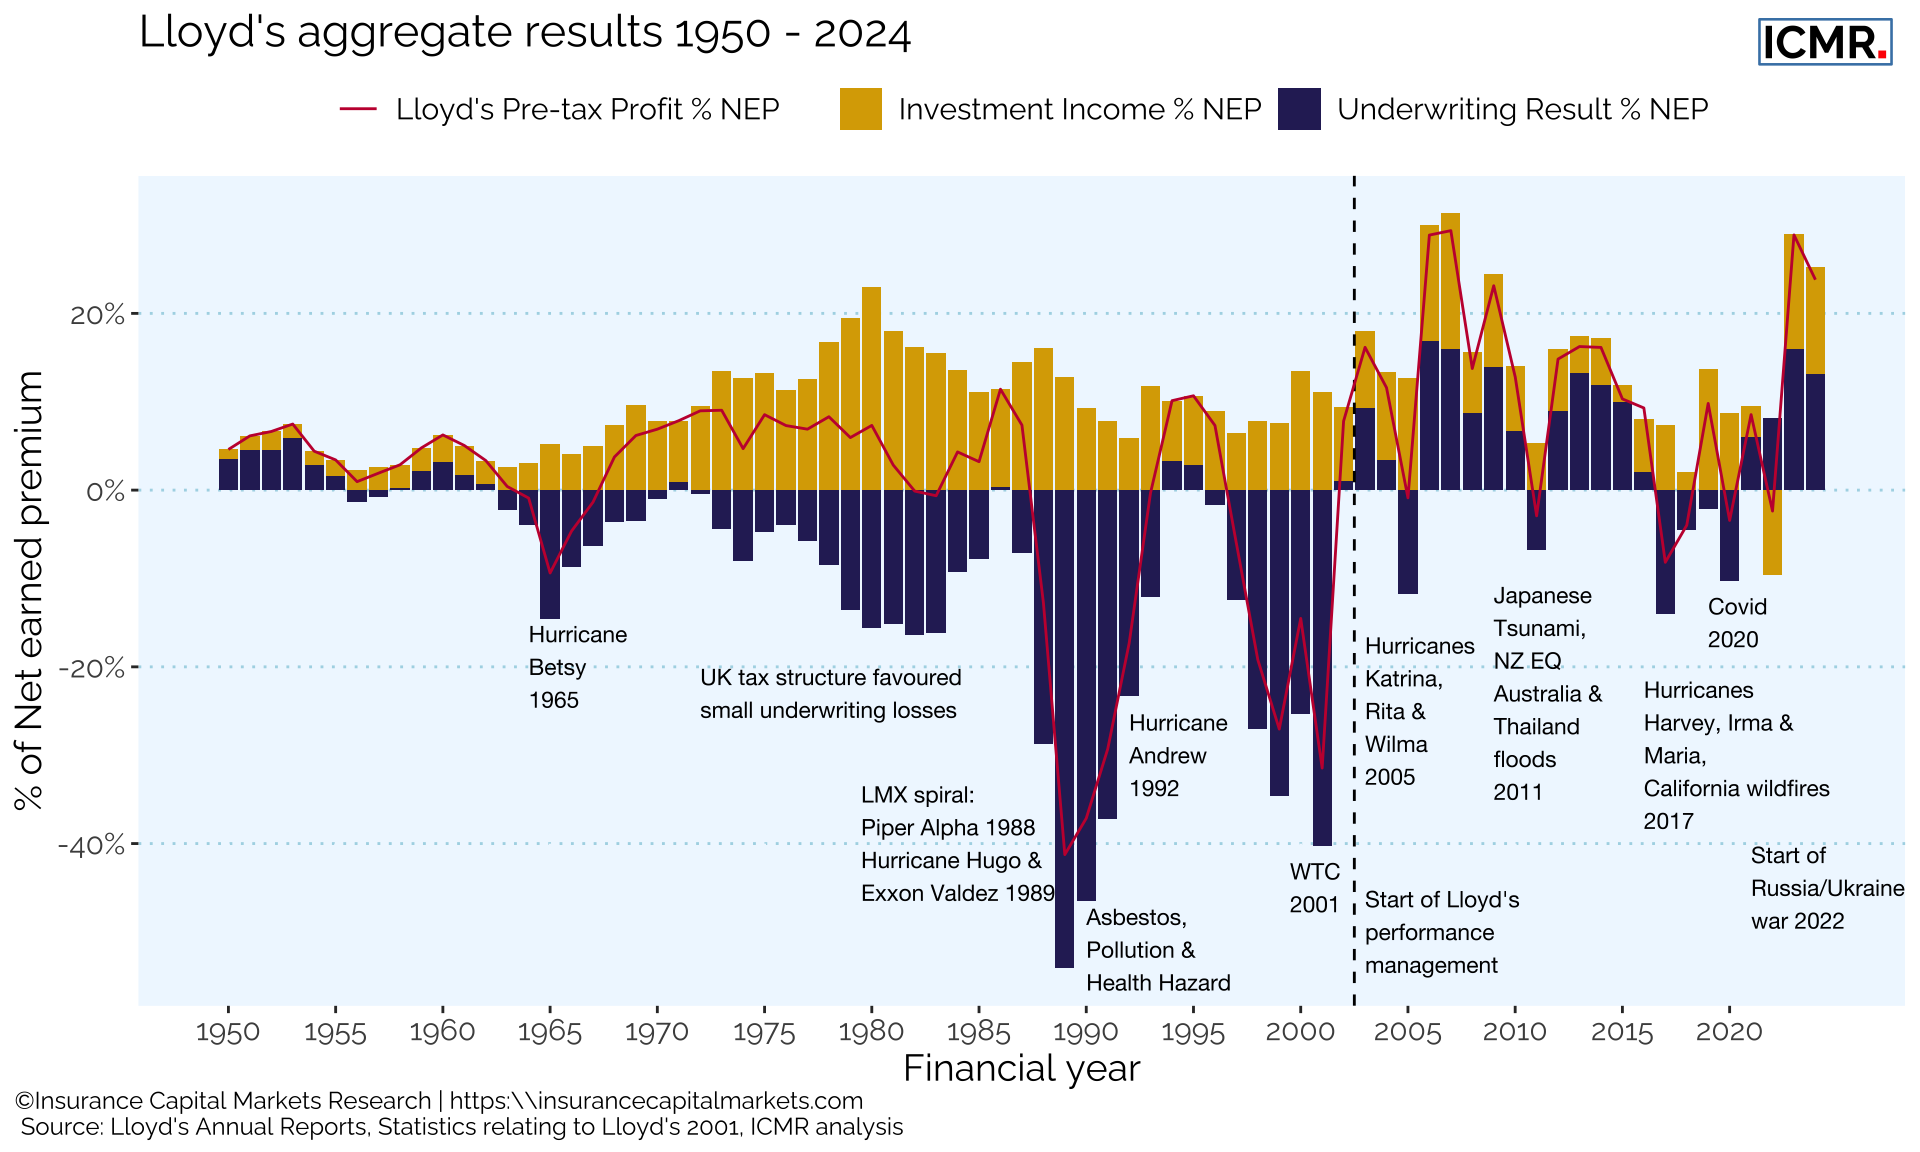
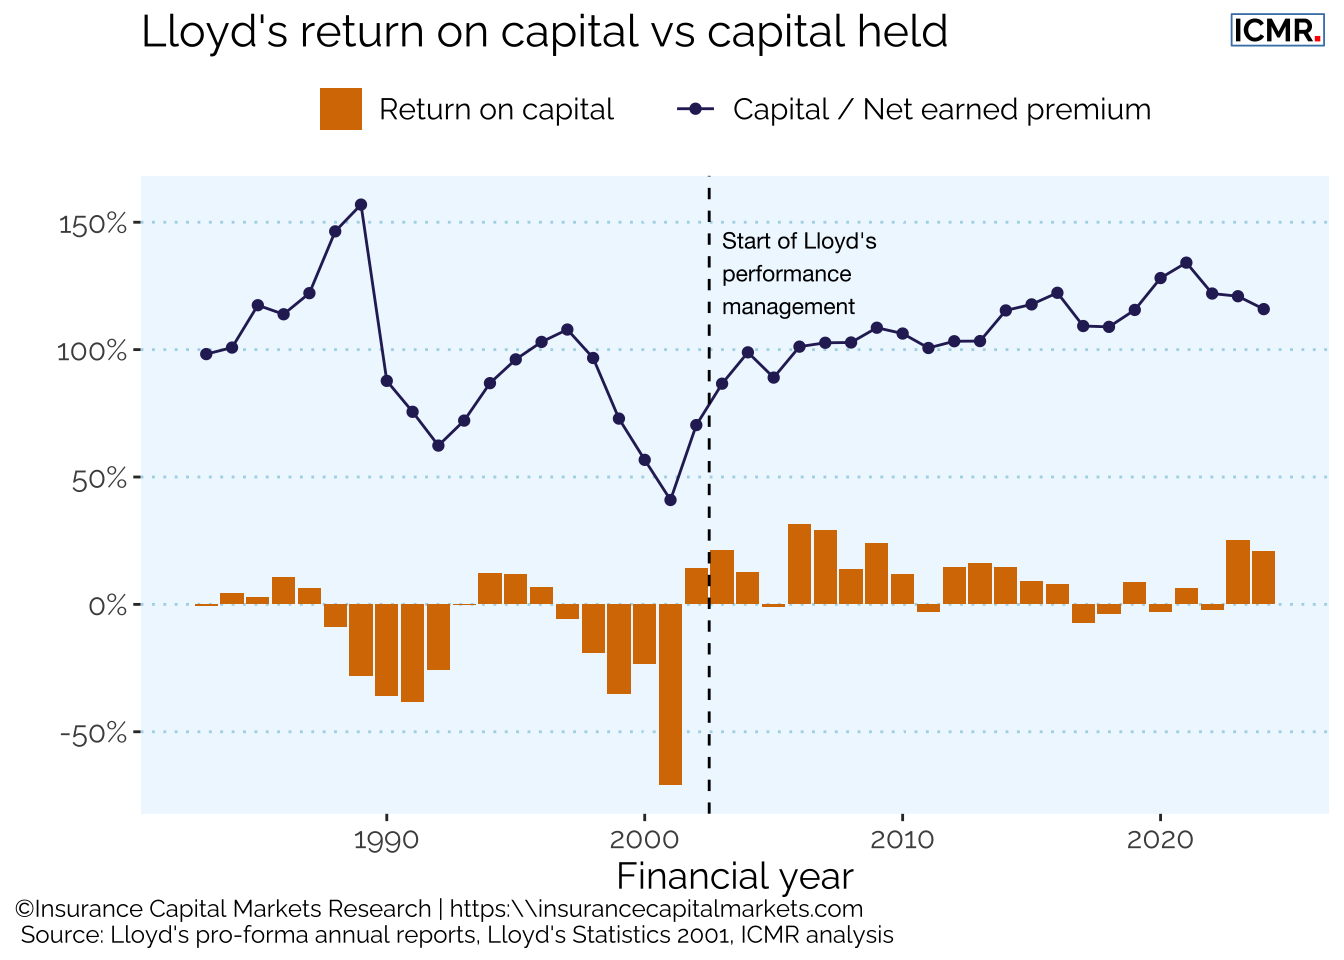
As shown by the blue bars representing underwriting results in Figure 2.4, the positive impact of performance management at Lloyd’s is very visible when looking across its long-term history. There is a marked difference after the introduction of the central oversight function in 2003 as outlined in the Lloyd’s Chairman’s Strategy Group Consultation paper.
The following Table 2.1, illustrates this further, showing the improved underwriting outcomes at lower volatility, alongside lower impairments at various return periods.
| Net loss ratio | Combined ratio | Net loss ratio | Combined ratio | Major claims loss ratio | |
|---|---|---|---|---|---|
| Mean | 61.9% | 102.4% | 59.0% | 94.8% | 10.3% |
| StDev | 12.01% | 13.15% | 9.39% | 9.56% | 8.12% |
| 1-in-5 | 69.3% | 109.2% | 65.2% | 104.8% | 12.7% |
| 1-in-10 | 76.4% | 119.6% | 73.0% | 110.0% | 22.6% |
| 1-in-20 | 80.2% | 130.1% | 74.4% | 111.7% | 25.3% |
| 1-in-50 | 89% | 139% | NA | NA | NA |
2.3 Lloyd’s exceeds cost of capital
In 2024 Lloyd’s has exceeded its weighted average cost of capital (WACC) for the second time this decade, see Figure 2.5.
The capital held at Lloyd’s remains much more stable as a function of the market’s premium since the introduction of Lloyd’s oversight function, see Figure 2.6. We believe this is the primary driver of the market maintaining both underwriting discipline and stable returns on capital.
2.4 Lloyd’s performance against other investments
Whilst Lloyd’s is a market, not a company, it can nevertheless be compared against a basket of alternative instruments given it publishes its own discrete financial statements. One such alternative instrument is the RISX index which acts as a proxy for capital markets confidence in underwriting returns which mimic those of Lloyd’s, and is therefore a benchmark for investor returns at Lloyd’s.
The RISX Index is an equity benchmark for the global specialty (re)insurance sector based on publicly listed companies with underwriting subsidiaries at Lloyd’s.
The RISX Index was developed by ICMR and is administered and calculated daily by Morningstar Indexes Ltd.
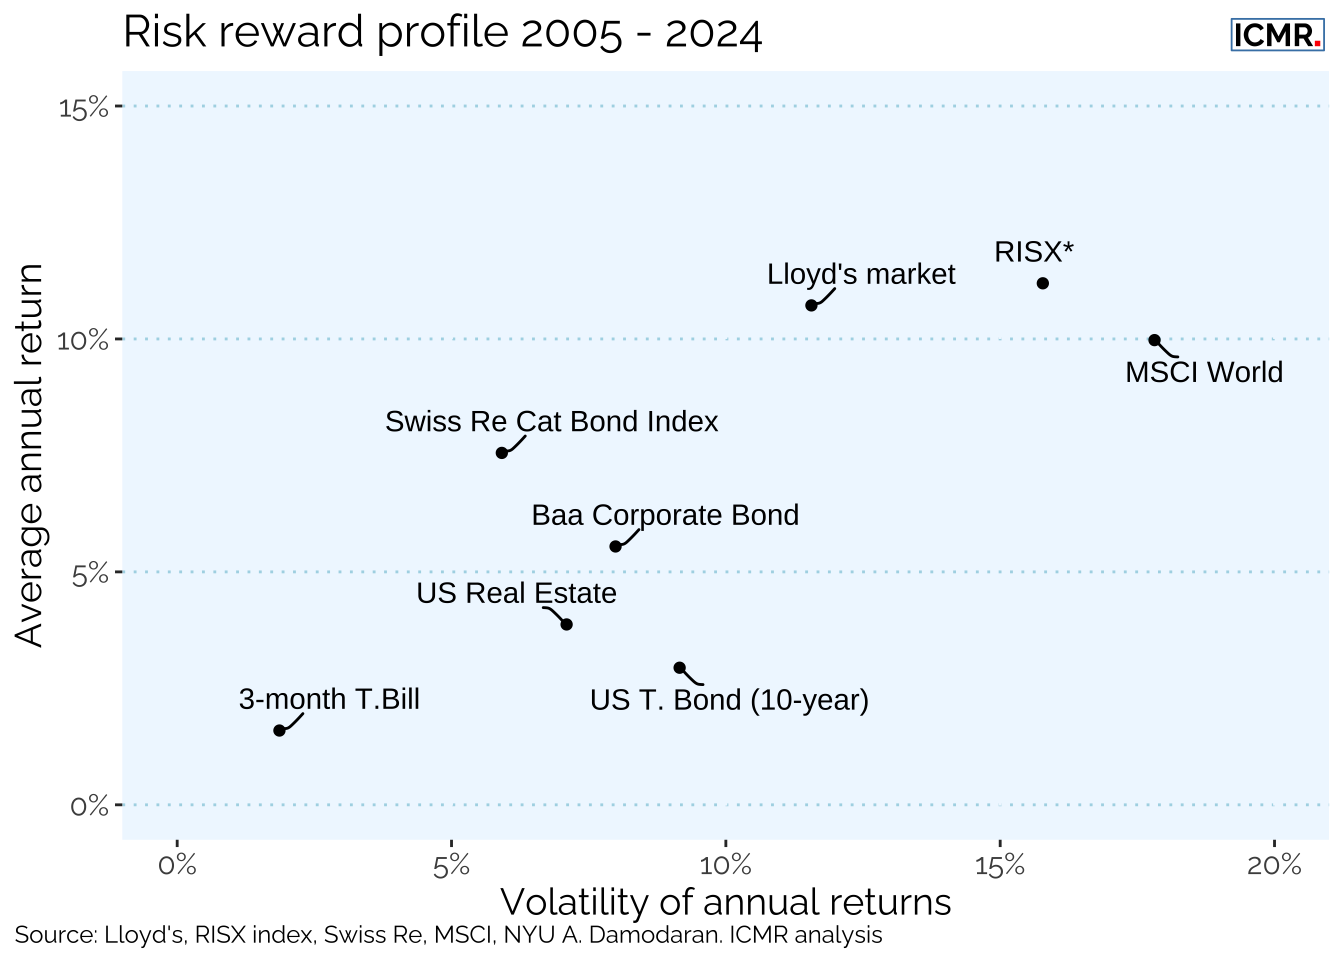
Lloyd’s returns on capital have traditionally compared favourably to Cat bond indices as well as other more mainstream investments. They have also, along with Cat bonds, shown lower correlation with those same mainstream investments represented by the MSCI World equity index.
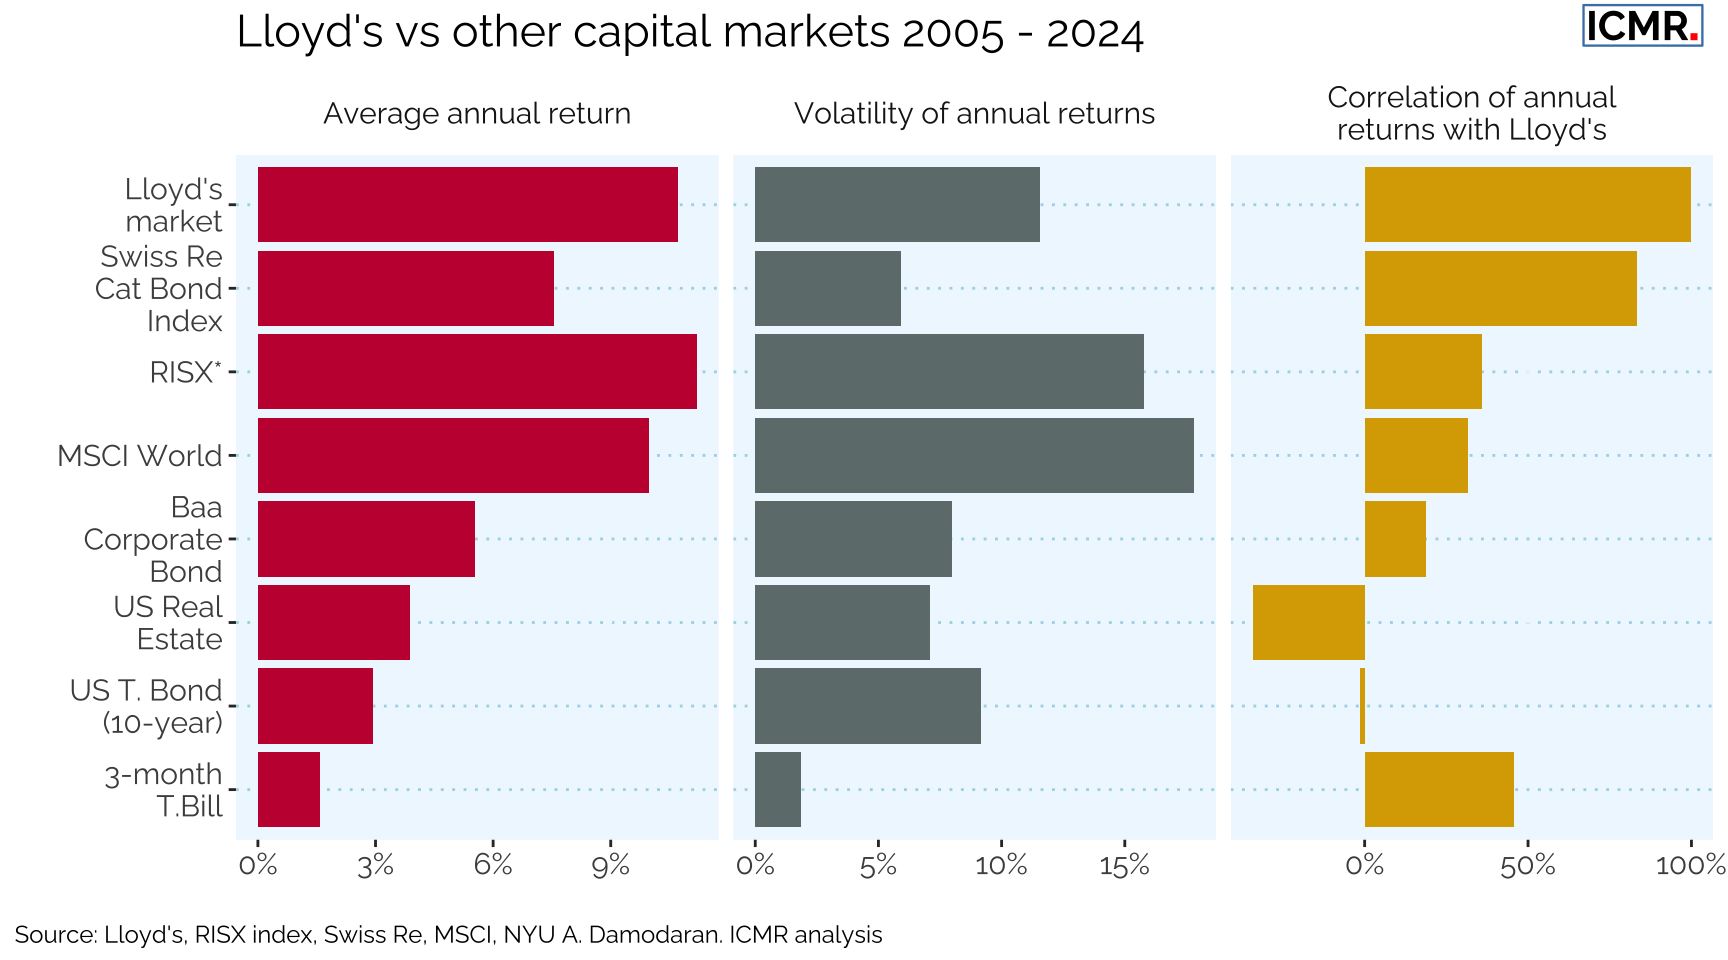
Lloyd’s overall market returns continue to show moderate volatility and low correlation with other asset classes and outperform Cat bond indices.
Lloyd’s 2024 results have been very positive despite the headwinds of significant hurricane events during the year, although at 7.8%, major losses for 2024 remain below the long-term average of 10%. Underlying combined ratio (excluding major losses) improved from 80.5% to 79.1%. The market’s recovery post-Covid does indeed appear to be robust in its ability to absorb major claims activity whilst still reporting near record figures.
There is no doubt that these results have benefited greatly from the elevated risk-free rate available on both Lloyd’s capital and its underwriting float. Indeed, for certain syndicates with significant asset leverage (i.e. financial investments as a ratio of capital and premium written) this elevated risk free rate may encourage underwriting to higher combined ratios whilst simultaneously exceeding Lloyd’s average return on capital to their investors. This is something Lloyd’s has specifically cautioned against as the market has seen this before and it did not encourage good underwriting behaviours.
With inflation appearing to have peaked and interest rates likely to reduce, there is a likely downward trend on total returns available. The best underwriting operations incorporate this as part of their cycle management strategy and maintain a technical approach to pricing, flexing their appetite for business in response to market conditions.
2.5 Outlook for 2025
In its recent analyst presentation, Lloyd’s projected gross written premium (GWP) growth of approximately 5%, targeting £60 billion for the 2025 calendar year. They’ve also indicated a combined ratio target of 90-95% and investment income of circa 4%. This guidance, coupled with the Q1 2025 Market Message’s reiteration of an ‘iron grip on underwriting’, suggests a continued focus on disciplined growth and profitability within the Corporation.
Using data from a Stamp Capacity (premium income limits) survey conducted by The Insurer at the close of 2024 and data from syndicates’ financial statements revealed for the established syndicates, i.e. excluding start-ups, SiaB and SPA, a circa 7% increase in capacity for the 2025 Year of Account (YOA). This expansion, while indicative of market confidence, necessitates a granular analysis to discern which syndicates are best positioned to capitalise on this growth.
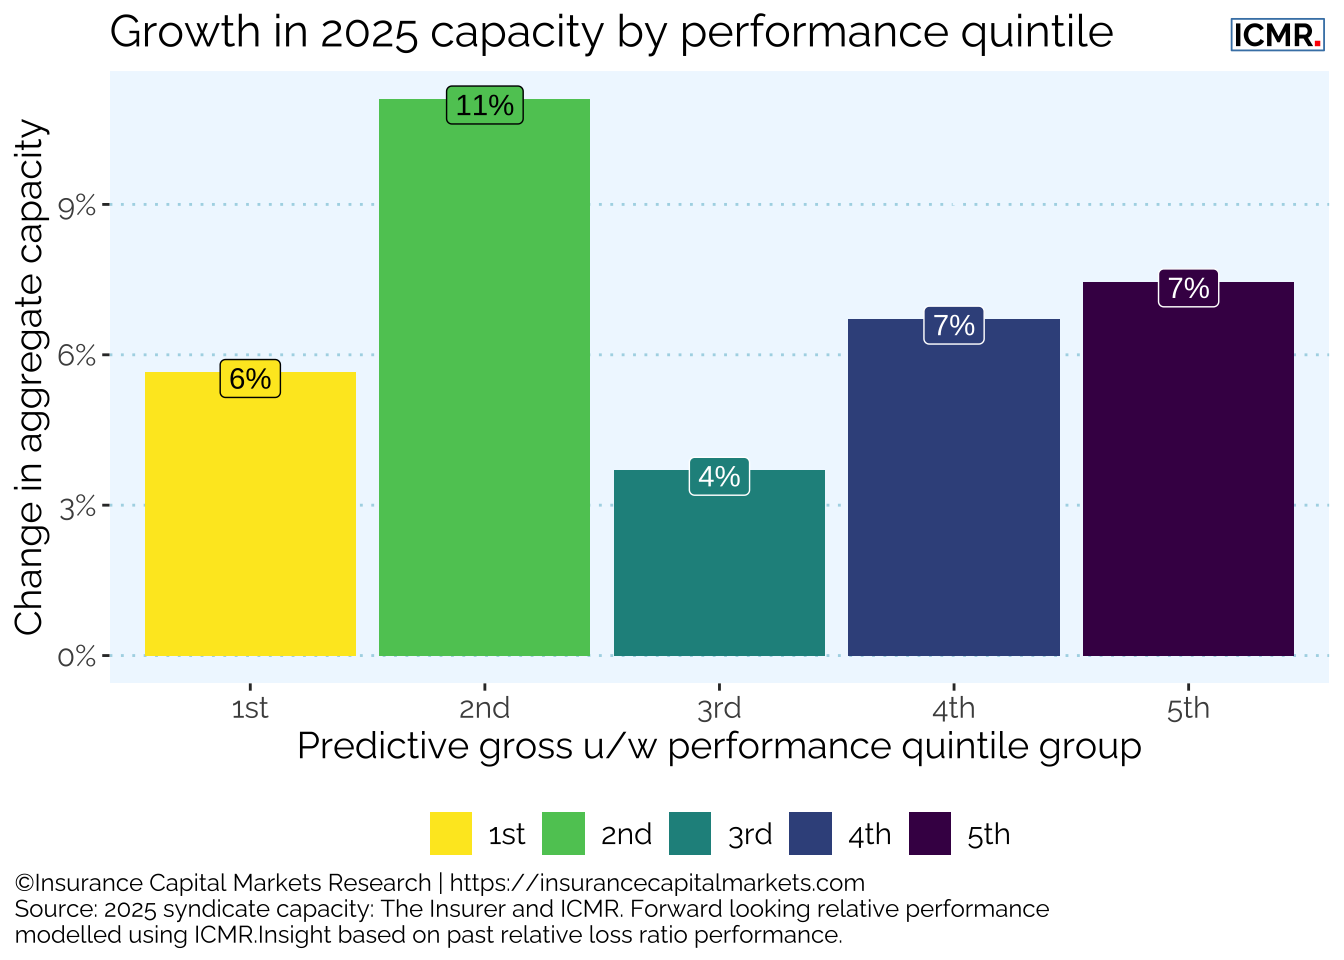
It is a truism within this market that historical relative performance often serves as a reliable indicator of future prospects. Utilising ICMR’s estimates of predictive relative performance, in conjunction with the aforementioned capacity growth survey, we can develop a more nuanced perspective on potential syndicate growth. Our preliminary analysis indicates that the out-performers are growing their capacity by 17% in the aggregate, but at the same the analysis shows that bottom quintile performers are growing their capacity by 14% in the aggregate, see Figure 2.9. This disparity warrants careful consideration, particularly given the Corporation’s emphasis on underwriting discipline.
The subsequent sections of this report will delve into a more detailed examination of individual syndicate performance, scrutinising underwriting metrics, capital adequacy, and strategic positioning to provide a review of past performance and future outlook.