7 Investment Analysis
Investment returns, as a function of individual syndicate’s investable assets, have followed the fortunes of the fixed income market over time. Depending on what mix of business syndicates underwrite, one syndicate’s investable assets could be many times that of another for the same unit of net earned premium.
7.1 Investment returns
The generally low interest rate environment is evident at the beginning of the period, Figure 7.1, followed by the material mark-to-market losses at year end 2022 following the uptick in inflation and interest rates. Returns appear now to be stable again at or around prevailing interest rates.
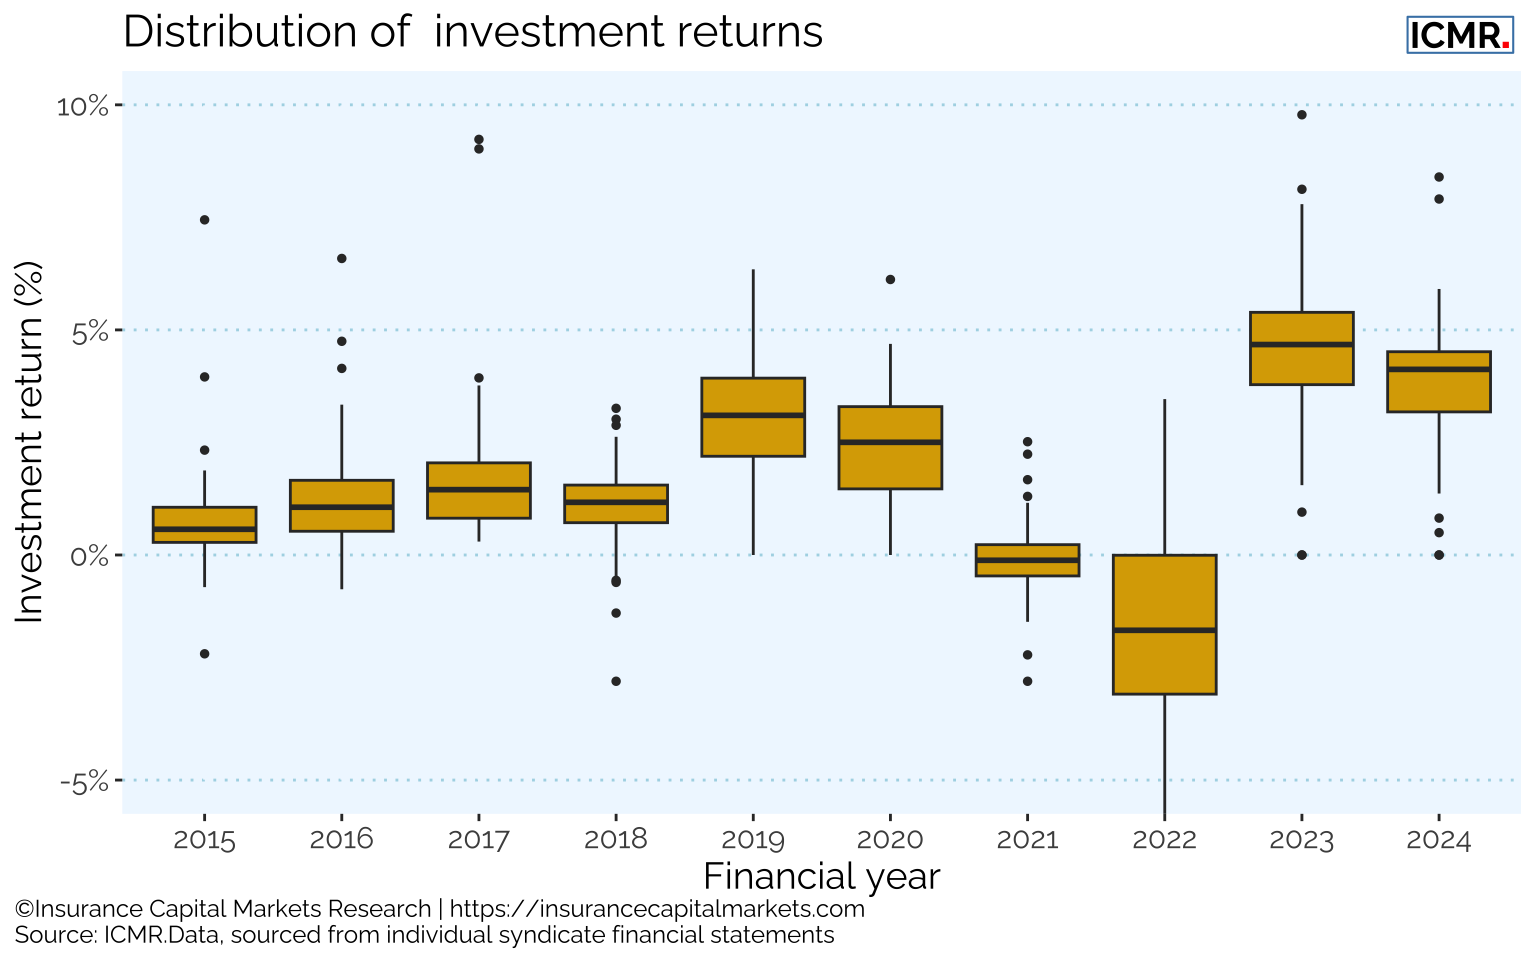
It should be noted that these figures do not include investment return on capital required to underwrite (Funds at Lloyd’s) as this is added at a market level in Lloyd’s pro-forma accounts.
7.2 Investment income contribution to total returns
The following chart Figure 7.2 shows the correlation between syndicates’ investment returns and their total financial investment over the last ten-year ends.
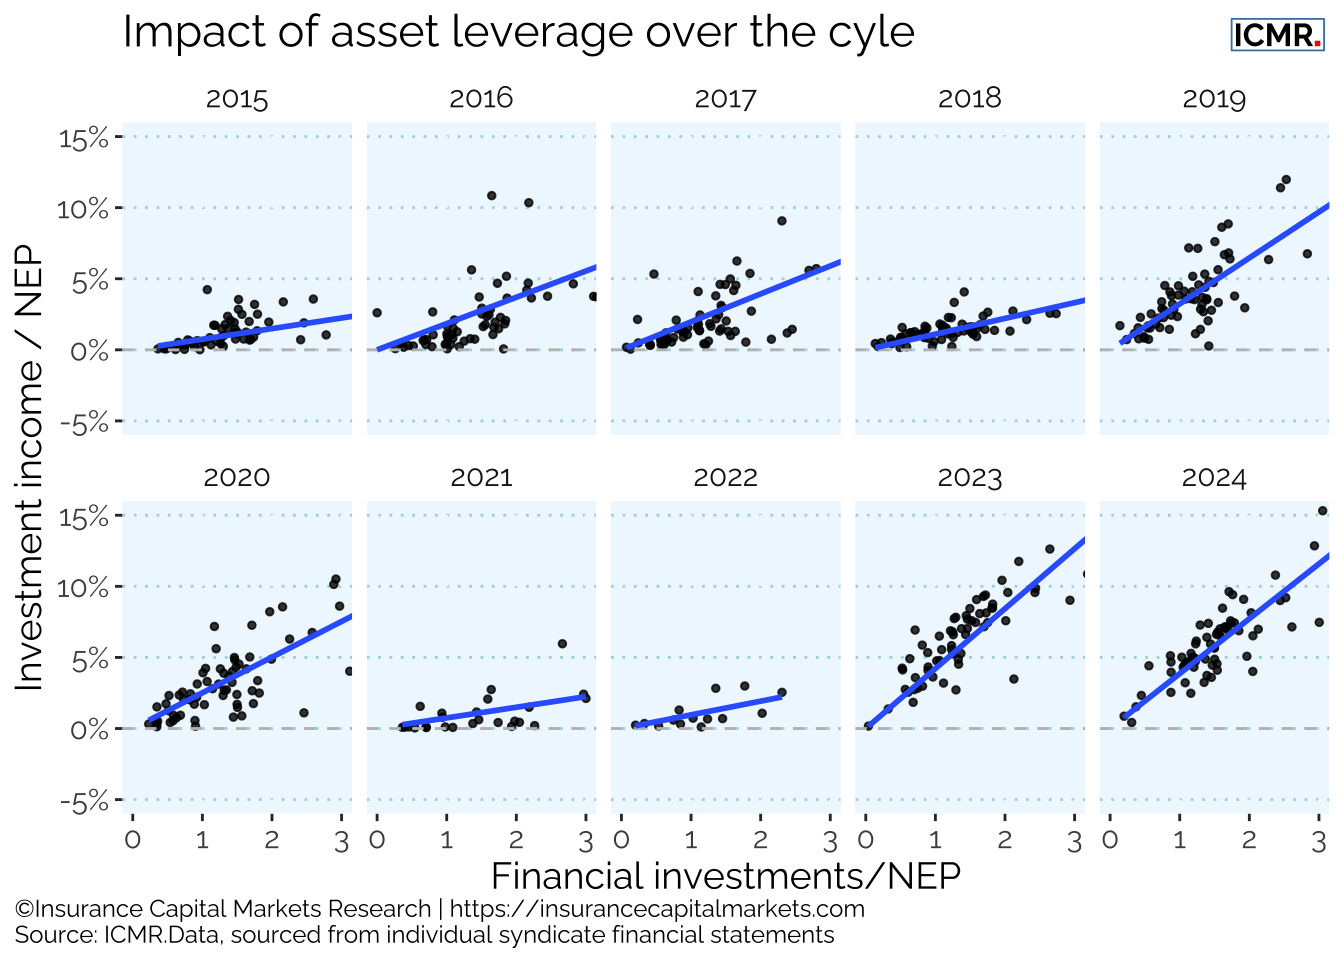
For each panel, the reported syndicate investment return (excluding any investment return on Funds at Lloyd’s) is shown on the y-axis as a function of reported net earned premium (NEP). The x-axis shows the corresponding financial investments reported on the balance sheet, again reflected as a multiple of the syndicates’ reported NEP. One would expect fairly close adherence to the average gradient, reflecting prevailing interest rates in the fixed income instruments usually held to redemption.
What is worthy of note is the significant range of multiples of NEP shown on each x-axis, showing the significant diversity of syndicate business plan strategies building very different underwriting float quantum. This is significant because of the generally higher interest rate environment we find ourselves in today, meaning the contribution to overall performance of investments for syndicates with greater financial investments can dwarf their pure underwriting result.
The Figure 7.3 shows the most recent year’s data in greater detail along with the average gradient lines split between aligned syndicates and non-aligned. It shows the trend in returns for aligned syndicates is noticeably shallower than for non-aligned, suggesting a different investment approach.
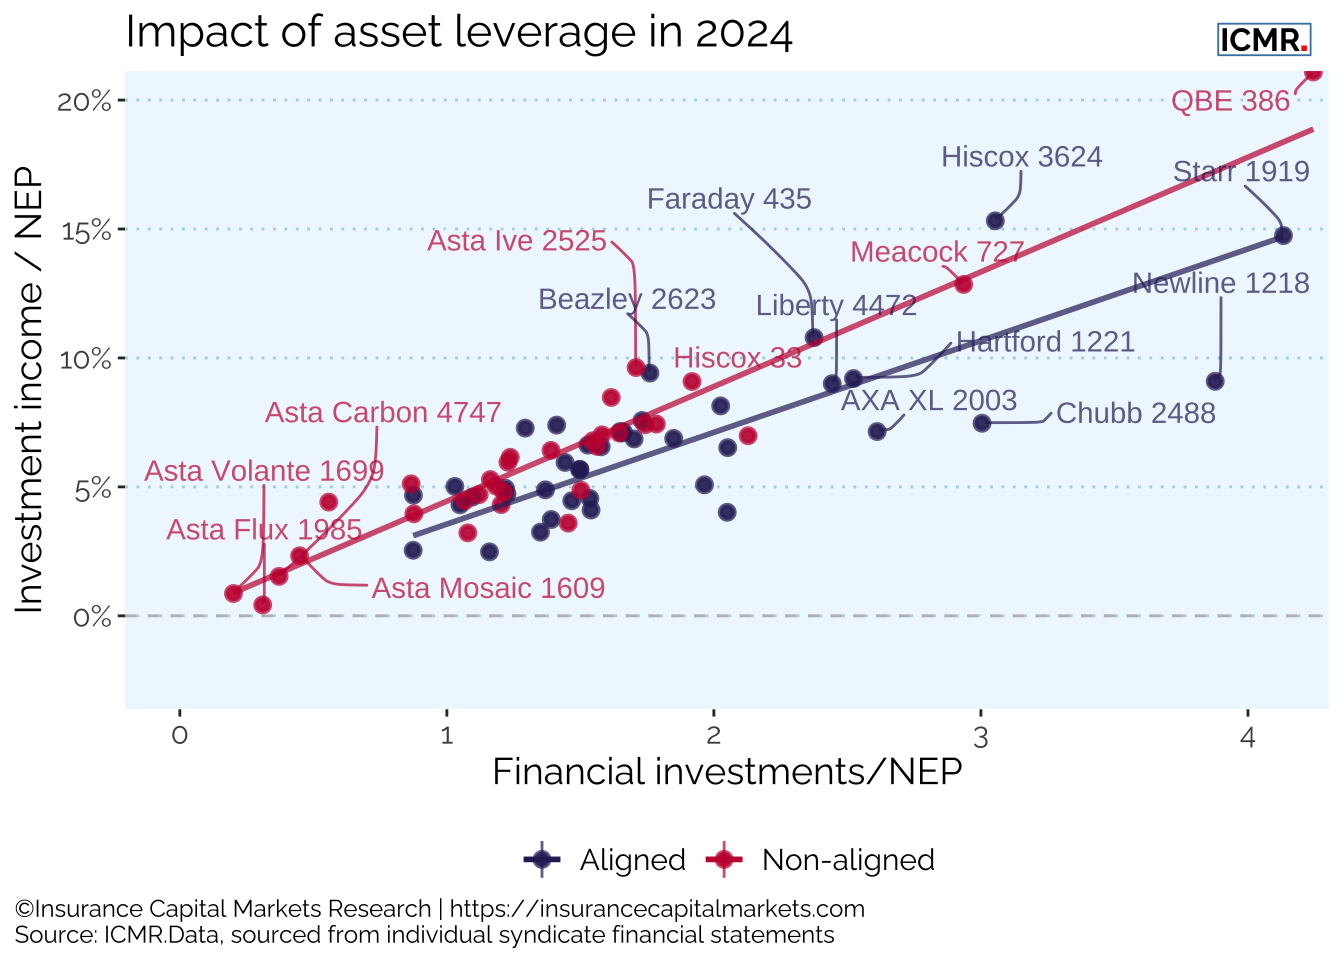
The importance of syndicate investment returns to Lloyd’s investors has always been very high, particularly during periods of generally higher interest rates. With syndicate asset leverage of up to 4x NEP, the contribution this makes to total returns can be extremely favourable, even as underwriting conditions weaken. It will remain a key test of syndicates’ interest cycle management that they can sustain total returns even as these rates subside over the medium term and not fall into the trap of relying on asset leverage to paper over any cracks in underwriting pricing.